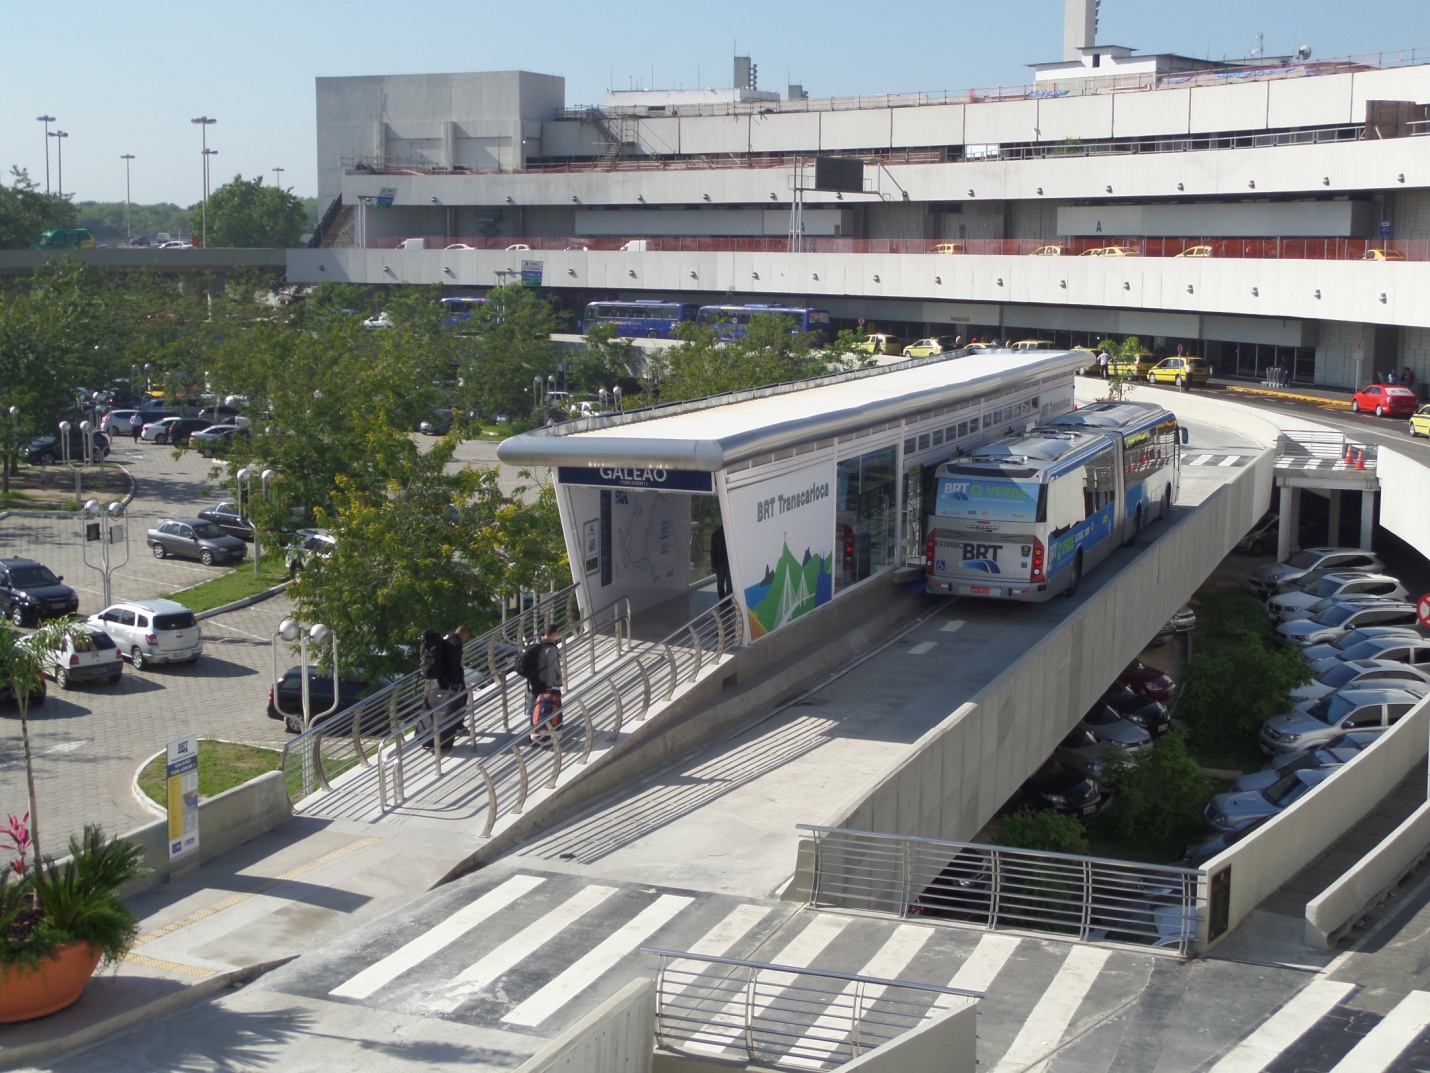
25.3Station Capacity
Strength does not come from physical capacity. It comes from indomitable will.Mahatma Gandhi, leader of the sucessful Indian independence movement against British rule, 1869–1948
BRT station saturation is discussed in more detail in Chapter 7: System Speed and Capacity. The discussion of capacity in this section should be considered as a supplement to that chapter. This section introduces some specific concepts of capacity related to the configuration of BRT stations, whereas Chapter 7 provides a more detailed and comprehensive coverage of BRT routes and overall operational capacity.
Stations have two nominal capacities that are dependant of each other:
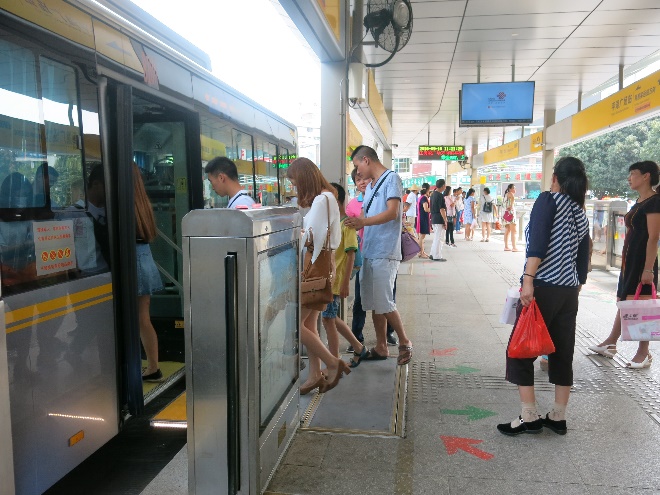
- Station Local Capacity: it relates to the number of passengers that use the station (as transfer point, or initial or fina destination in the system; it can be referred as Boarding Capacity (at Station) and it could be defined by the maximum number of passengers that can possibly enter the system thru that station during one hour and not allow queue formation.
- Station Global Capacity: it relates to the: number of passengers that enters or exits the station, regardless of boarding and alighting there (i.e. we are also counting passengers that are entering and exiting inside the BRT vehicle ; it can be referred as System Capacity (at the Station) and it could be defined by the maximum number of passengers that can possibly leave (or arrive) at the station inside a BRT vehicle during one hour, without queue formation.
The no queue formation part is important, because if queue formation was allowed, the number of passengers would increase, but the speed of service for all users would decrease. When the context is not defined by "boarding passengers per hour" or "passengers per direction per hour" one
Once the station is the bottleneck of the system, the lowr global capacity station in a corridor defines the corridor (system) capacity.
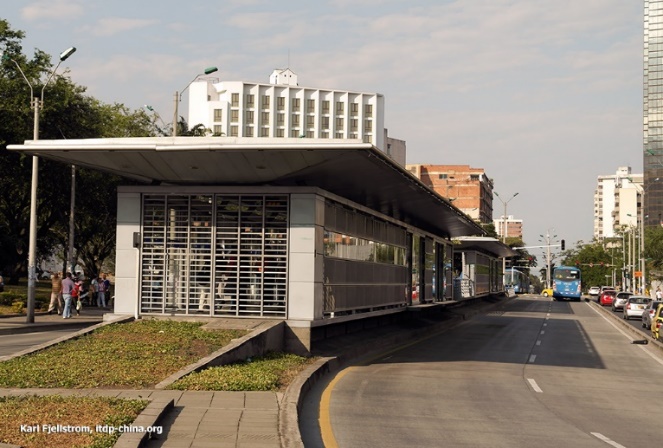
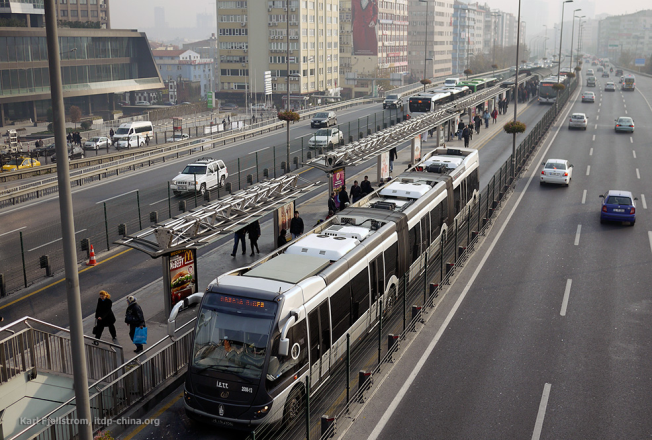
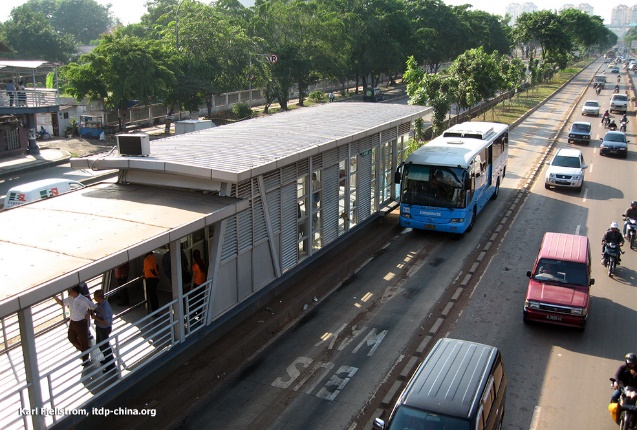
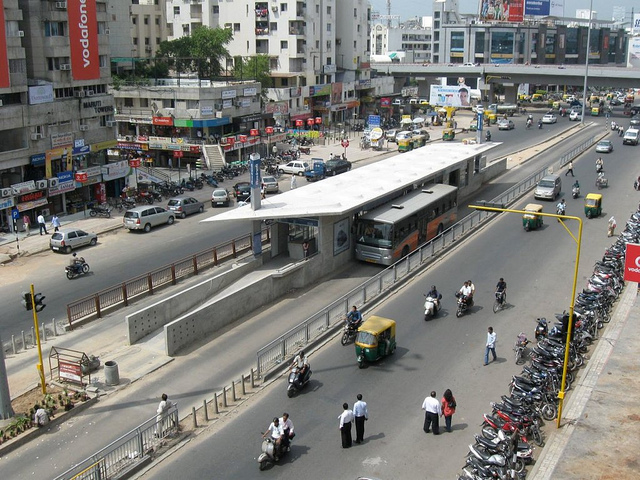
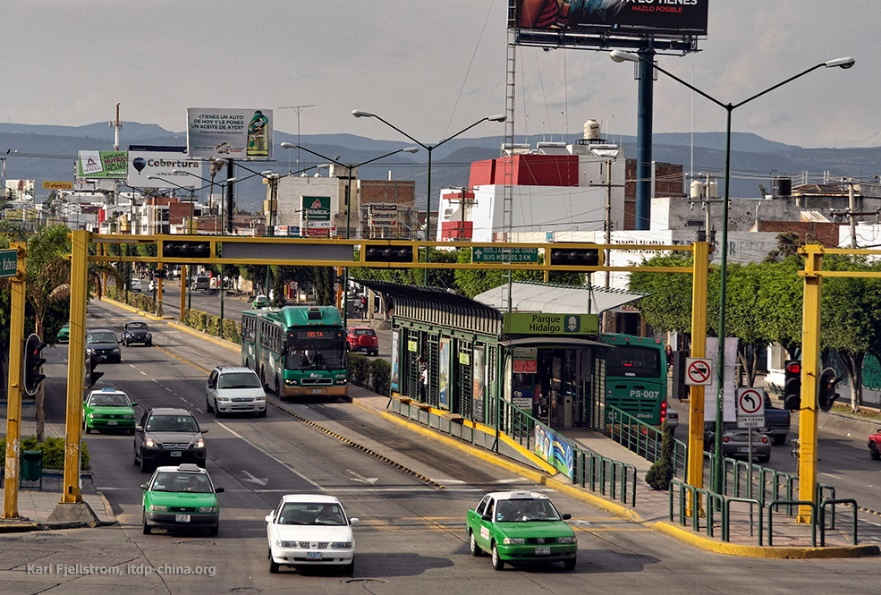
BRT stations can be broadly divided according to global capacity by whether or not they have passing lanes and sub-stops, and whether the stations have more than one bus docking bay in each direction and sub-stop. High capacity systems feature BRT stations with passing lanes and multiple sub-stops. Medium capacity systems do not have passing lanes, but have multiple docking bays. Low capacity BRT systems have stations with no passing lanes and only one docking bay in each direction.
Considerable fluidity exists in each of the categories below, especially in cases where features such as passing lanes, sub-stops, and multiple docking bays are provided but do not actually function properly due to design shortcomings.
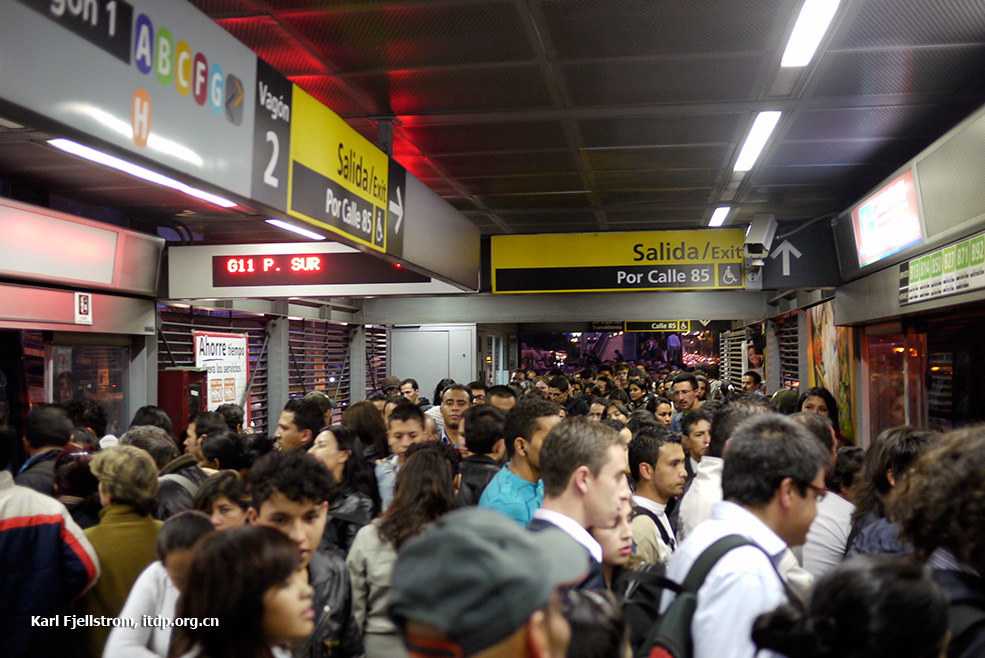
Using the criteria mentioned above and explained further later in this chapter, Table 25.1 categorizes BRT systems as either high, medium or low capacity. The categories in Table 25.1 are based on BRT station design capacity rather than the actual operating capacity. (BRT system capacity is also influenced by factors other than BRT stations, including the operational and intersection design, as discussed in Chapter 7.) Table 25.1 also lists the actual operating capacity measured in field surveys by ITDP. In general, the higher-capacity stations correspond to the higher throughput systems, though there are exceptions. From Table 25.1 it can be seen that the Los Angeles Silver Line has a high design capacity but a very low throughput, meaning the corridor can handle more demand easily and that could be obtained through densification around the corridor or using direct services to bring more people to the system. Conversely systems with a low- or medium- design capacity but relatively high throughput – such as Istanbul, Xiamen, Mexico City, Zhengzhou, Urumqi, Chengdu, and Quito – are likely to suffer from overcrowding, delays and bus queuing at some stations during peak hours. More critically, especially in cities which are still growing, these systems are likely to be already operating at or above capacity limits and hence have little capacity to take on extra ridership or growth.
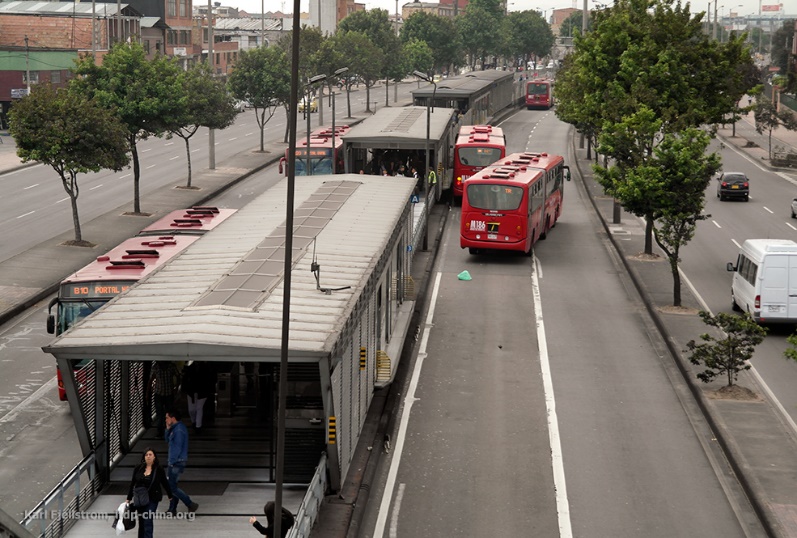
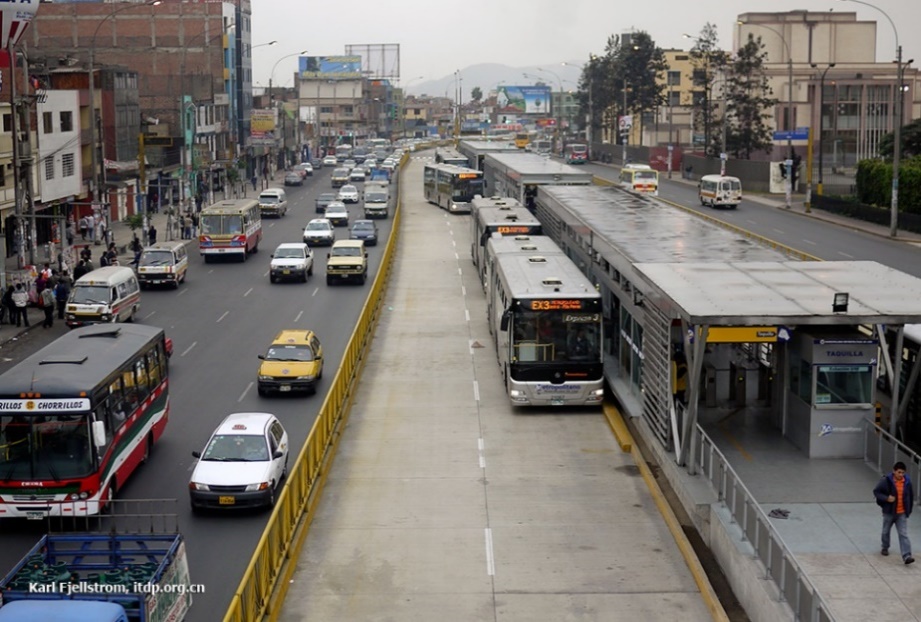
The fact that a station is classified as ‘high’ capacity in Table 25-1 does not mean that stations do not suffer from overcrowding. Some of Bogotá’s BRT stations suffer from severe overcrowding despite the fact that stations have a high-capacity design. A major problem in this regard is that most station sub-stops in Bogotá have only one bus docking bay that serves several routes. This results in crowding passengers for one route obstructing alighting passengers as well as passengers waiting to board a different route at the same sub-stop. Table 25.1 includes a listing of the high-capacity stations which have only one docking bay at each sub-stop: Bogotá, Lima, Peru, and Cali, Colombia. Cape Town, South Africa, despite having passing lanes, has BRT stations predominantly with neither multiple sub-stops nor multiple docking bays. For this reason despite having passing lanes, the design capacity is classified as low.
With regard to Table 25.1, the design capacity of the station is only one factor in the system performance and overall capacity. Other key factors include the use of larger buses, express services, the number and width of doors in the buses, off-board fare collection, the level of crowding in stations and buses (extreme crowding can lead to extra delays in boarding and alighting), operational configuration (including the number of transfers), intersection design along the BRT corridor, and the stopping distance between the bus and the platform. Closer distances between the bus and the platform may take longer for drivers to execute, having the effect of reducing speed and capacity, but will enable passengers to board and alight more quickly, which has the effect of increasing speed and capacity.
Table 25.1Classification of selected BRT systems into high-, medium- and low- capacity stations
| City | passing lanes & sub-stops > 75% of stations | >1 docking bay >75% of stations | design capacity* | >1 docking bay per sub-stop | actual throughput (pphpd) | year of throughput count |
|---|---|---|---|---|---|---|
| Bogotá | Yes | No | HIGH | No | 37,700 | 2013 |
| Guangzhou | Yes | Yes | HIGH | Yes | 27,400 | 2014 |
| Istanbul | No | Yes | MEDIUM | 18,900 | 2012 | |
| Lima | Yes | No | HIGH | No | 13,950 | 2011 |
| Cali | Yes | No | HIGH | No | 11,100 | 2013 |
| Xiamen | No | No | LOW | 8,360 | 2012 | |
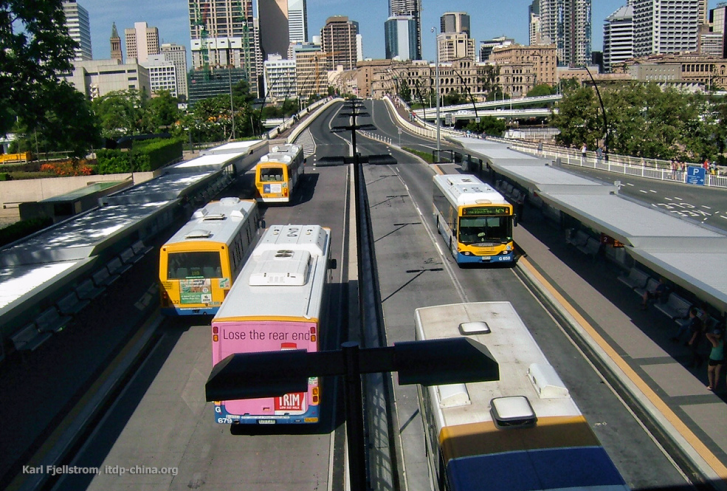
| Brisbane | Yes | Yes | HIGH | Yes | 7,700 | 2014 |
| Mexico City | No | Yes | MEDIUM | 7,550 | 2013 | |
| Zhengzhou | No | Yes | MEDIUM | 7,230 | 2014 | |
| Urumqi | No | Yes | MEDIUM | 6,950 | 2013 | |
| Chengdu | No | YES | MEDIUM | 6,650 | 2014 | |
| Lanzhou | Yes | Yes | HIGH | Yes | 6,550 | 2013 |
| Quito | No | No | LOW | 6,000 | 2008 | |
| Jakarta | No | No | LOW | 3,400 | 2013 | |
| Beijing | No | No | LOW | 2,750 | 2013 | |
| Changzhou | No | No | LOW | 2,650 | 2013 | |
| Jinan | No | No | LOW | 2,050 | 2014 | |
| Leon | No | No | LOW | 1,950 | 2013 | |
| Ahmedabad | No | No | LOW | 1,200 | 2012 | |
| Bangkok | No | No | LOW | 1,200 | 2011 | |
| Nantes | No | No | LOW | 1,200 | 2011 | |
| Paris | No | No | LOW | 1,200 | 2010 | |
| Los Angeles | Yes | Yes | HIGH | Yes | 1,000 | 2013 |
| Cape Town | No (OT yes, SS no) | No | LOW | No | 750 | 2012 |
| Nagoya | No | No | LOW | 500 | 2013 |
* Note that this is an overall estimate of capacity. In some cases cities have a combination of “low” (with only one docking bay per direction) and “medium” (with two docking bays per direction) stations.Source: data from www.worldbrt.net, accessed 8 October 2014. Throughput counts are all based on actual ITDP field counts. Actual system capacity is determined not only by stations, but by a range of operational factors described in the chapter on BRT capacity and speed.
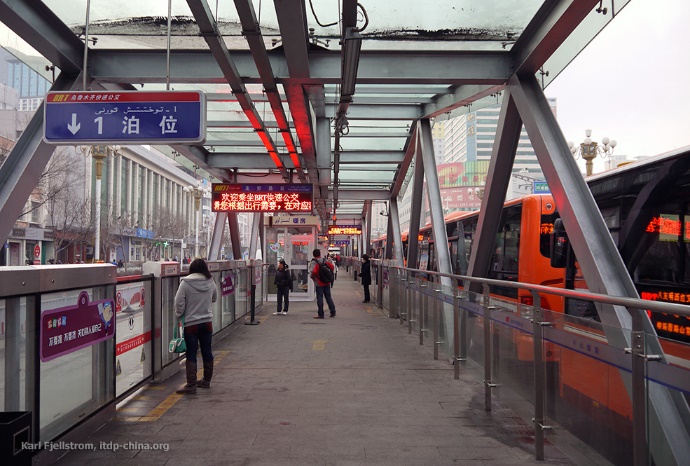
25.3.1Station Sub-stops
A sub-stop is a station subdivision or module. When equipped with passing lanes, one BRT station can be divided into multiple sub-stops. In order to function, sub-stops require passing lanes or a functional equivalent such as in the directional BRT stations used in Lanzhou and Yichang, China. Calculation of the capacity of station sub-stops is covered in more detail in Chapter 7.
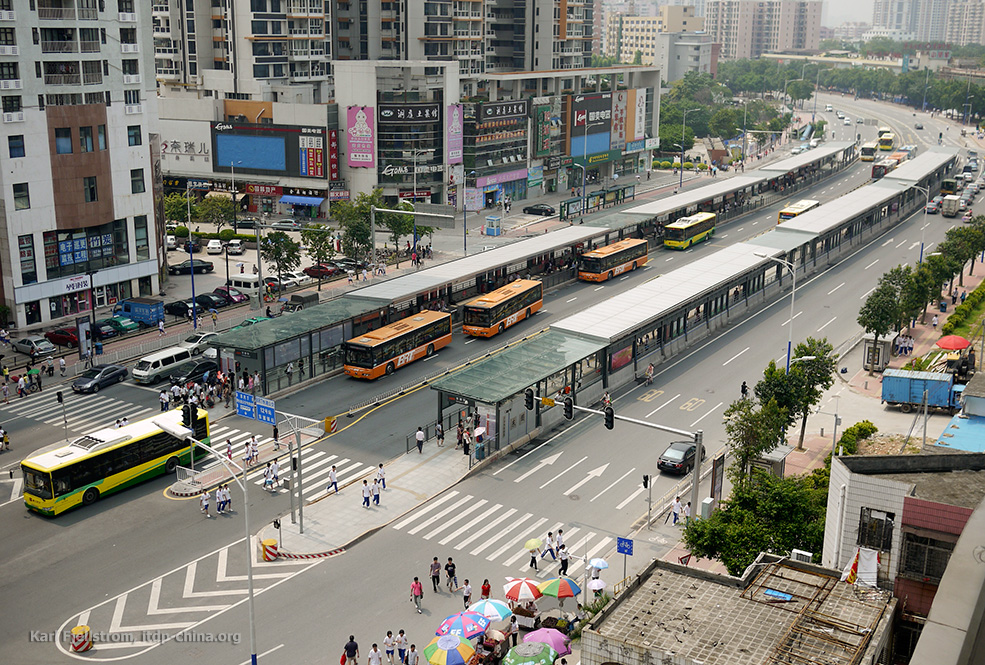
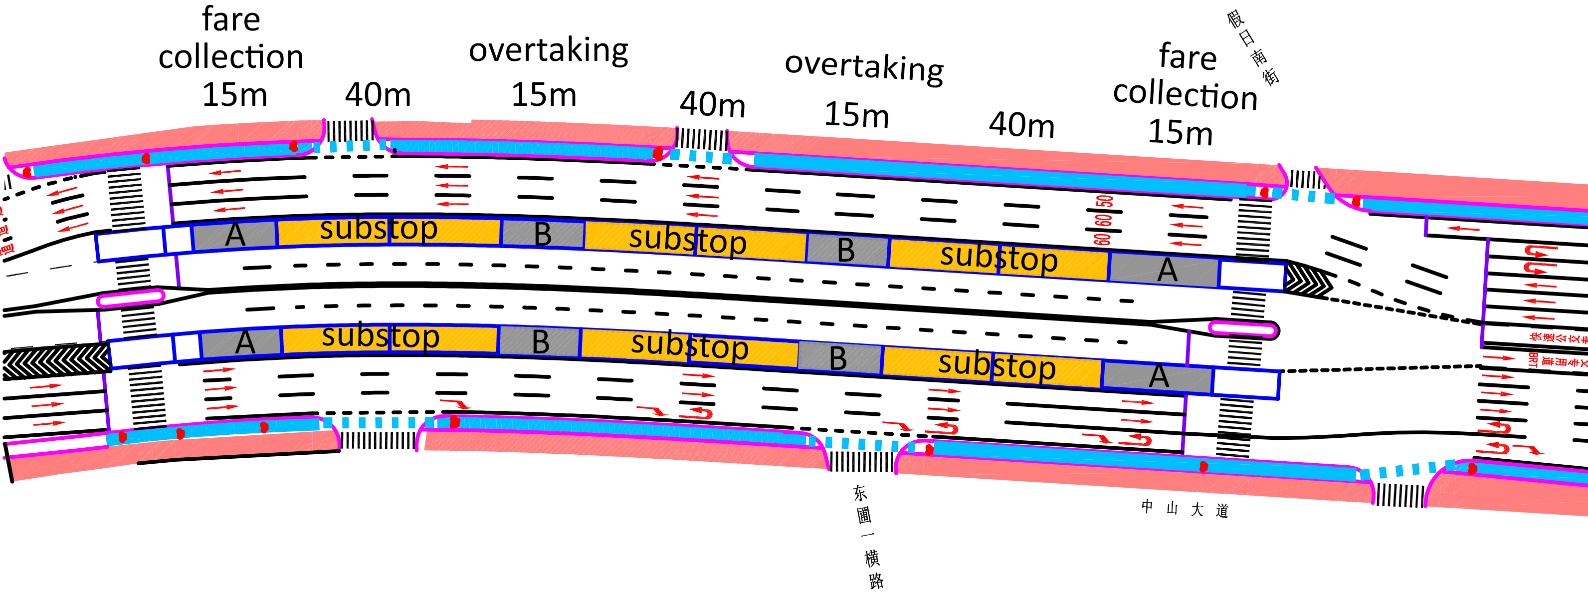
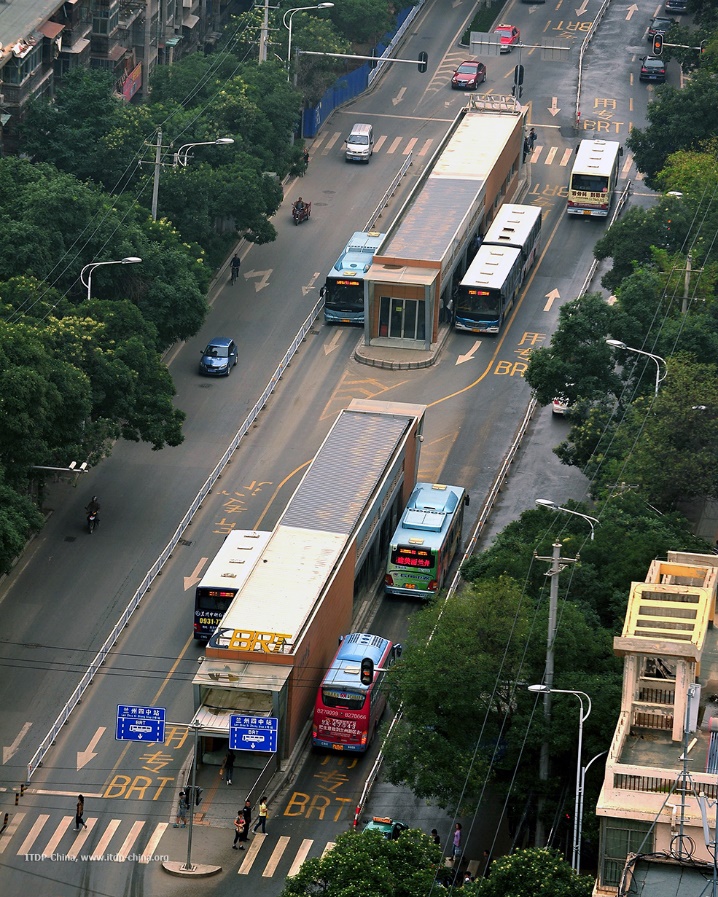
Figure 25.13 shows an example of Dongpu BRT station in Guangzhou, China, which has three sub-stops in each direction. Each sub-stop is forty meters long, with docking bays for two 18-meter buses or three 12-meter buses. Fare collection space is 15 meters, though in more recent designs ITDP uses a more compressed 10-meter space for fare collection.
25.3.2High-capacity System Stations
High-capacity BRT stations are those with functioning passing lanes and multiple sub-stops. There are, however, exceptions. Istanbul’s BRT is one of the world’s highest capacity BRT systems, with nearly 20,000 passengers per hour per direction (pphpd) but without passing lanes or sub-stops. Istanbul, however, is a very special case based on an expressway right-of-way with no traffic lights and contra-flow traffic operation which ensures zero encroachment of other vehicles, no defined docking bays inside the station, and particular demand and road network conditions that are difficult or impossible to duplicate elsewhere.
High-capacity BRT – with the exception of Istanbul’s particular circumstances, which like Brisbane does not clearly define bus docking bays – requires passing lanes with sub-stops.
25.3.3Medium-capacity System Stations
Medium-capacity BRT stations are those without passing lanes, but with more than one bus docking bay in each direction.
25.3.4Low-capacity System Stations
Low-capacity stations have neither passing lanes nor sub-stops, and have only one docking bay for BRT vehicles.
25.3.5Modularity and Scalability
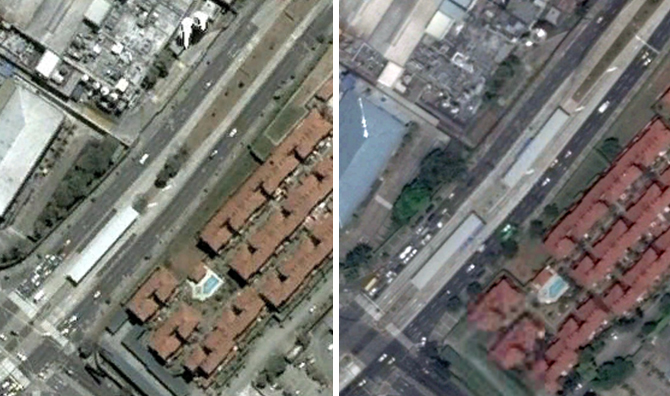
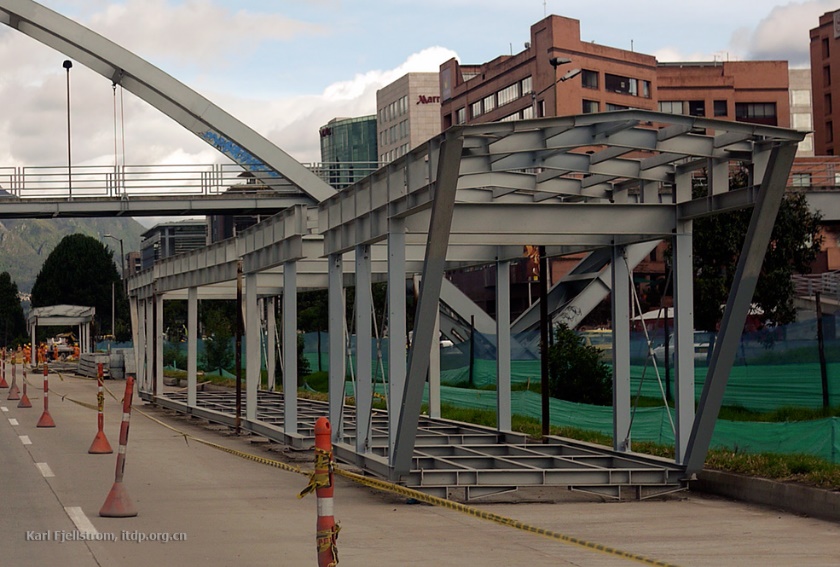
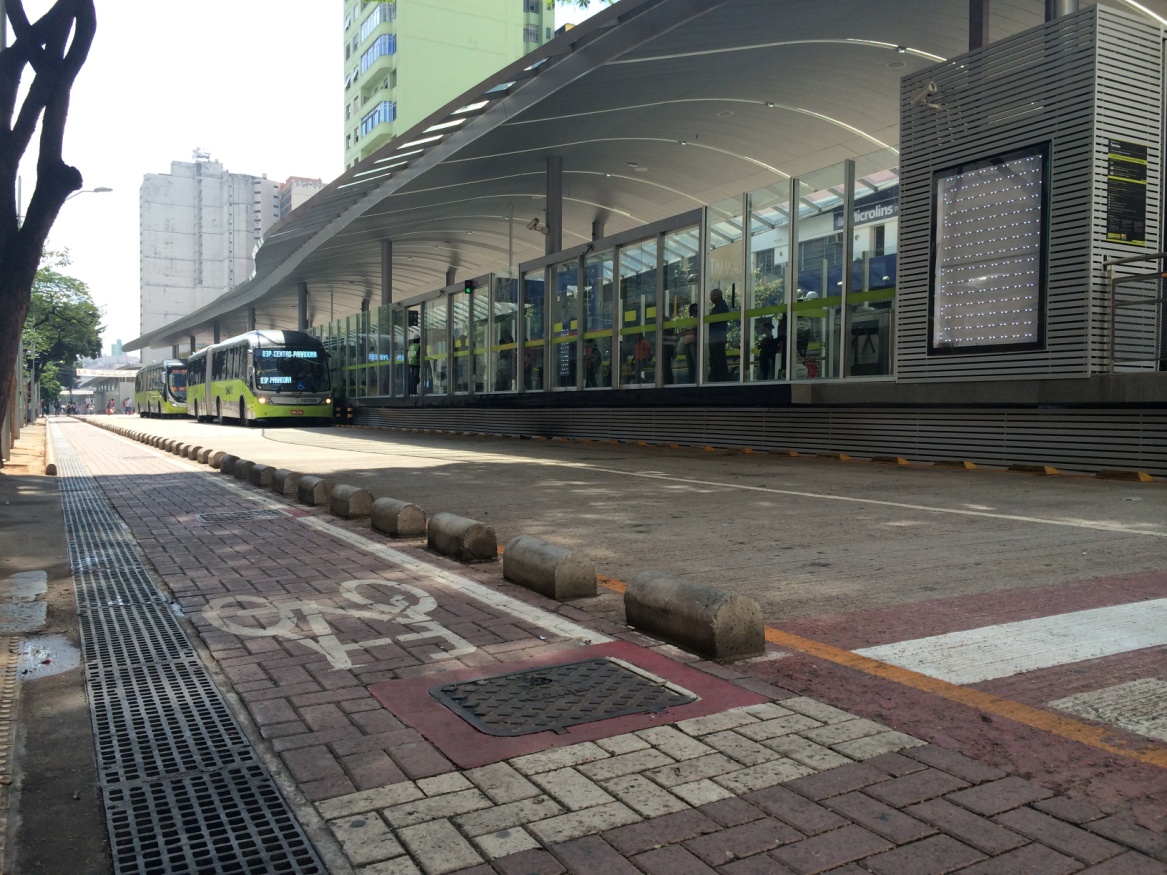
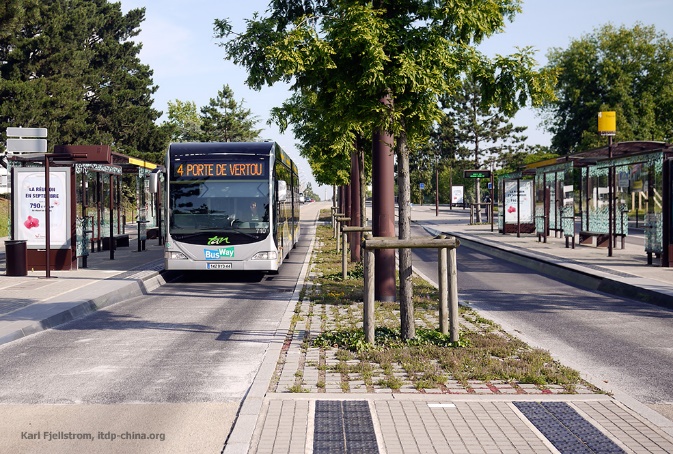
In situations where expansion may be necessary within ten to twenty years, BRT stations should be designed accordingly. Modular BRT stations can be expanded through the addition of station sub-stops. Bogotá’s TransMilenio provides an excellent example where space was provided for expansion, as was done at the Calle 100 station. The station had two sub-stops in 2005, but another was added as demand increased, so that by 2013, the station had three sub-stops.
Cali has also added station modules at some crowded stations. The Chiminangos BRT station originally has only one sub-stop, but again space for expansion was left, so that another sub-stop could be added, as it was, when demand required it. Although it would have been preferable to build a larger station from the beginning, the modular approach to station design makes it possible to fairly easily add station modules at particular overcrowded stations. It is much more difficult, or usually impossible, to achieve the same expansion in stations which have not been designed with a modular approach to sub-stops. But space must also be reserved for expansion in the roadway.
Modularity also may help with fabrication and construction costs and impacts. By fabricating most of the station off-site, it hopefully can reduce the construction impacts of the corridor, as the station can have the foundation laid directly in the corridor and then then station can be placed on that.