25.7Station Components
Oh, here it is. The instructions to fit in, have everybody like you, and always be happy! Step one; Breathe... Okay, got that one down. Step two; Greet today’s smile and say: Good Morning City!Emmet Brickowisk, as voiced by Chris Pratt in The Lego Movie, 2014
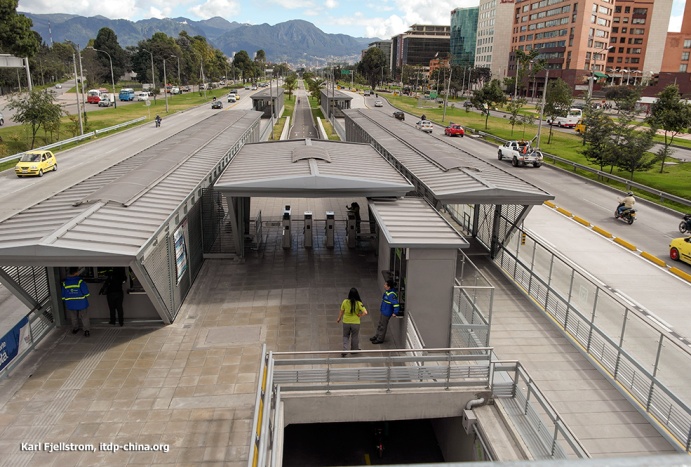
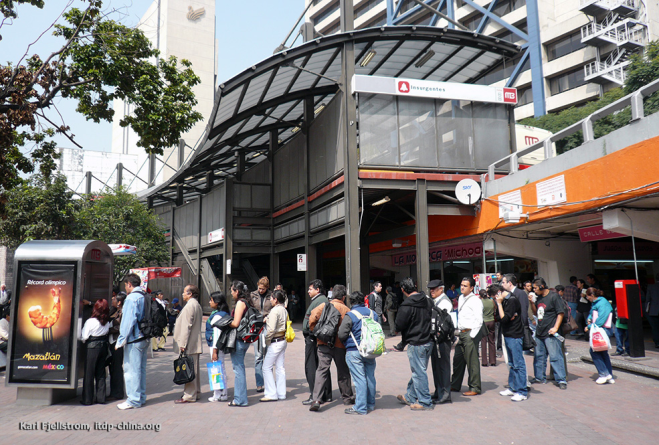
25.7.1Access & Arrival Area
The access and arrival area is the front door of the station. It is where people arrive via ramp, stairs or elevators from a crosswalk, bridge or tunnel. An at-grade crossing is preferred. As discussed above, it is critical to locate crossings along desire lines in order to maximize utility. An important consideration is that people may use the crosswalk, bridge or tunnel simply to cross the street, not to access the stations. Those volumes and need for queuing space must be included in any calculation. Bicycle parking may also be located here. See Chapter 29: Pedestrian Access, Chapter 30 Universal Access, and Chapter 31 Bicycle and Pedicab Integration for more detail.
The key priority in planning and designing the access and arrival areas to the BRT station is to ensure as direct and convenient access as possible.
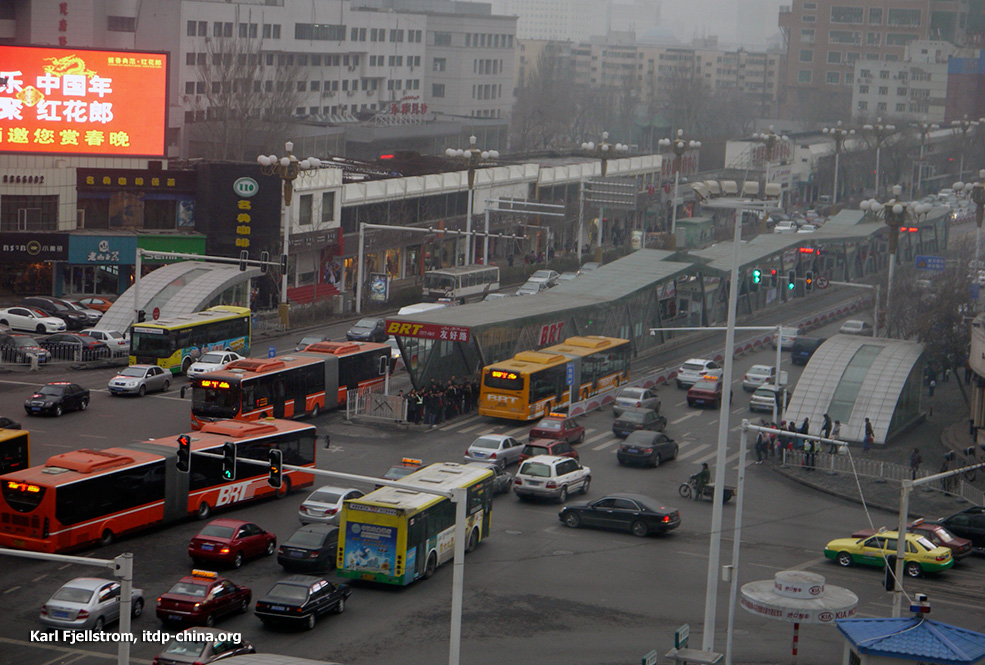
In the Urumqi station pictured in Figure 25.60, the poor station access design means that passengers can only access the station from one side of the road, leading to large unnecessary additional walking trips for many passengers. In this figure, a passenger traveling between points A and B would first need to walk to the intersection (C), then cross the street-level crossing to D, then go through the pedestrian tunnel to E, and then walk along the walkway (trying to avoid the cars also parking on the walkway) to B. The total actual walking distance that the passenger would need to traverse is 400 meters. The straight line distance between A and B is twenty-three meters. Although since this photo was taken a footbridge has been built which reduces the walking distance from A to B to a mere severnty-five meters, this still compares poorly to the twenty-three meters straight line distance.
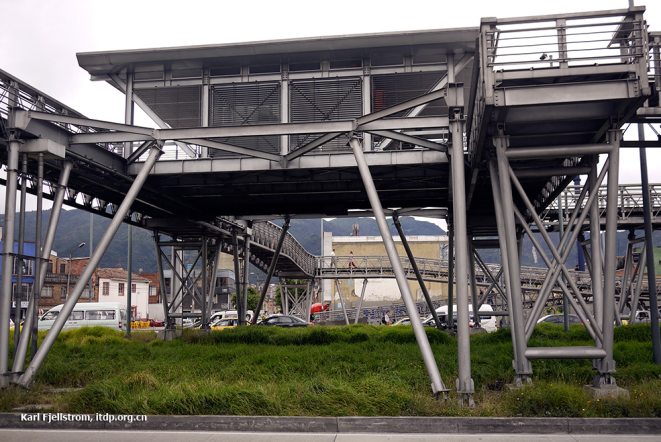
Similarly BRT expert Pedro Szasz’s analysis of the Transjakarta Busway and how to improve various problems showed that the measure which would have the single biggest benefit in terms of passenger time savings was to add stairs or ramps to reduce the unnecessarily long walking distance to access the BRT stations (Figure 25.61). Poorly designed station access can impose a penalty of hundreds of meters of extra walking distance for BRT passengers, and this ‘access penalty’ will deter many passengers from using the BRT system. In the case of Jakarta, pedestrian access was the worst deficiency of the system according to the summary in Table 25.4, because it occurs at most of the stations and during all eighteen operational hours.
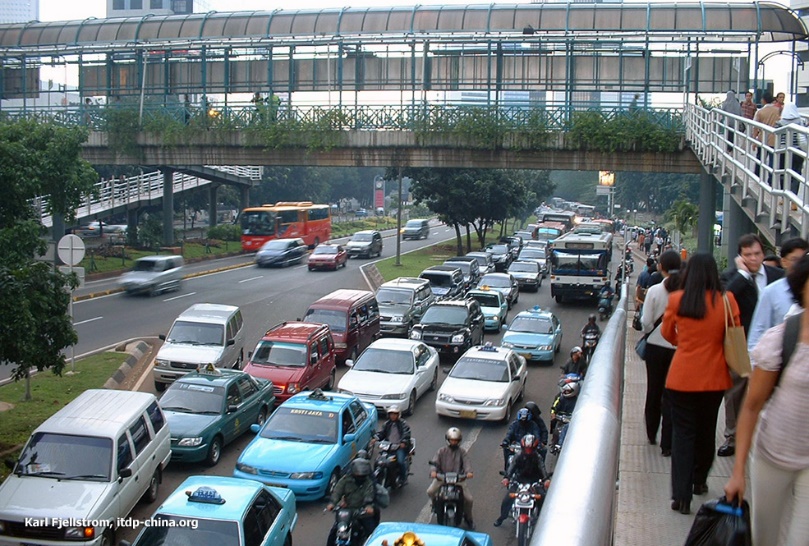
Table 25.4Summary of problems and consequences identified in the Transjakarta Busway from December 2008
| Problems | Equivalent travel time delay per trip (minutes) | Description |
|---|---|---|
| Pedestrian access | 11 | Lack of stairs and additional bridges or at-grade crossings with pedestrian signals. Bridges double-back, adding walking distance |
| Passenger transfers | 3.5 | No routes interchange corridors, so most passengers lose time walking to and waiting for the second route |
| Lack of buses | 3 | Buses are less than needed to attend demand, especially during the evening peak |
| Low velocity | 1.5 | Buses on some stretches and hours travel at low speed |
| Bus access on bus station | 0.2 | Drivers stop far from the bus stop, especially at some stations on curves |
| TOTAL | 19.2 |
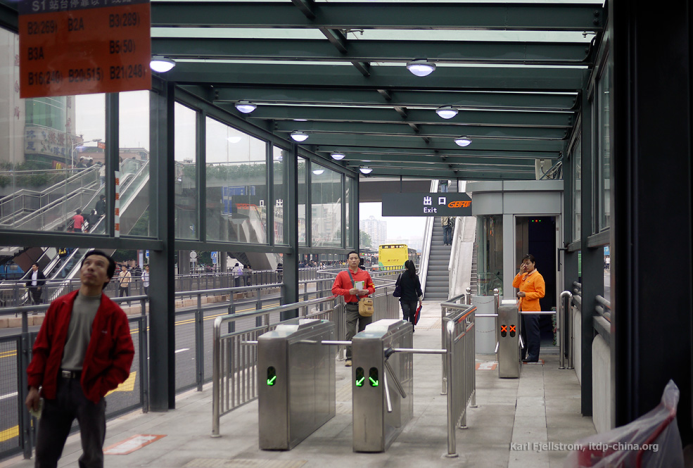
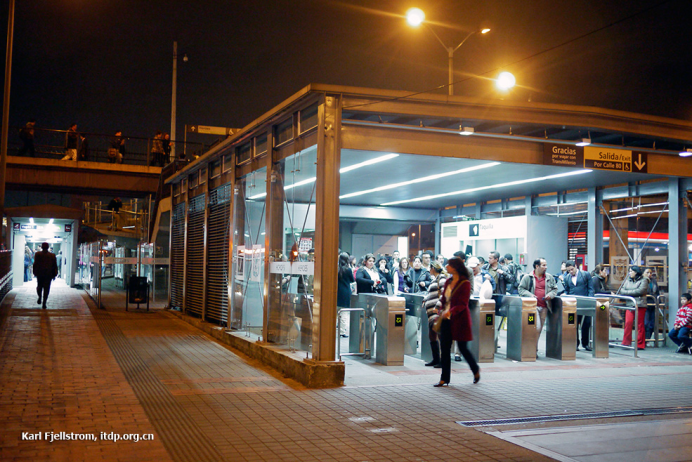
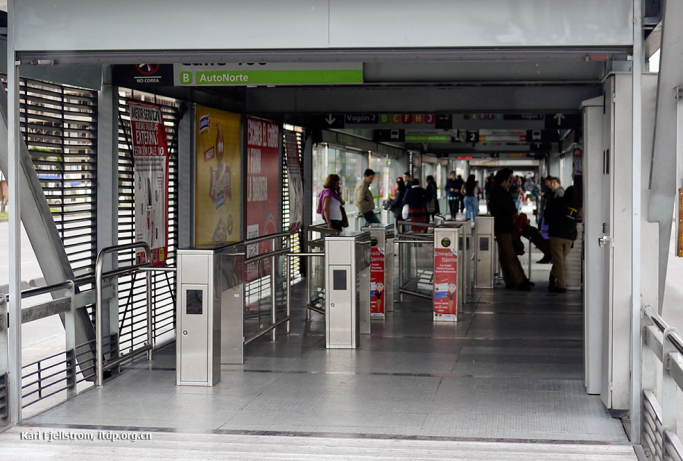
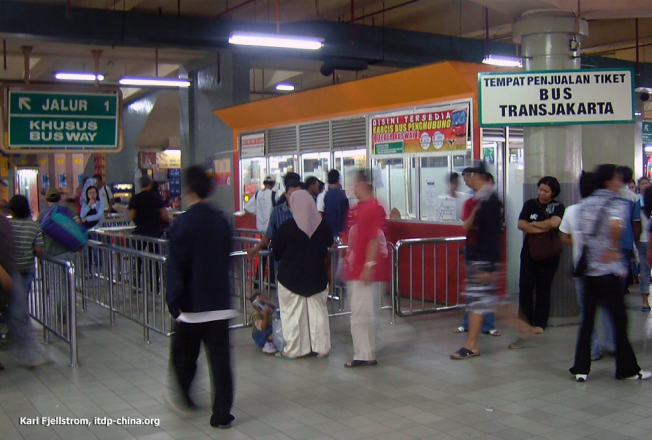
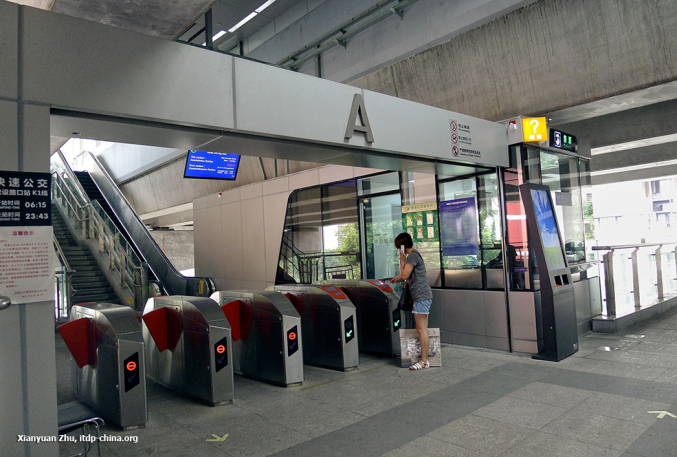
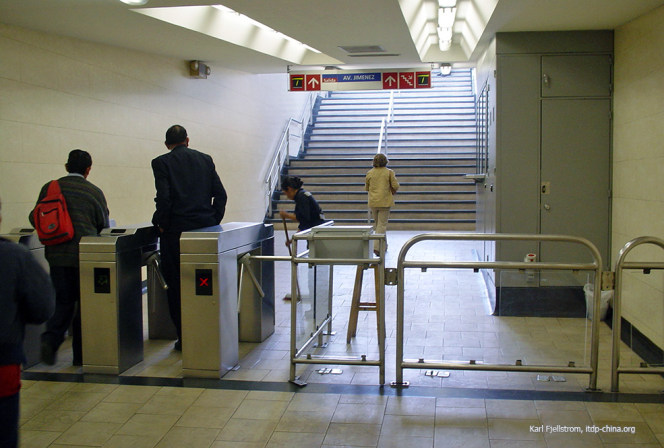
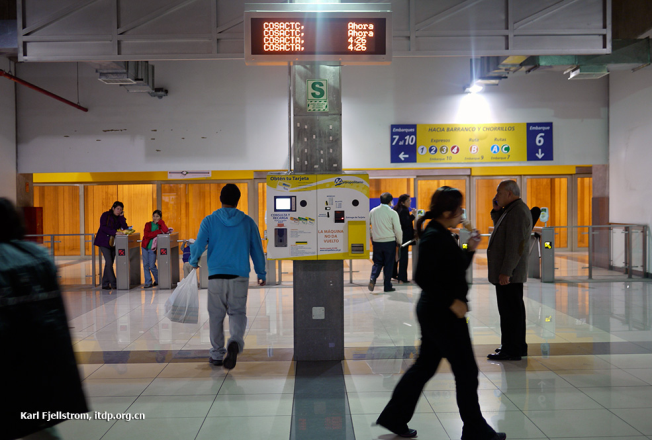
25.7.2Entrance Area and Fare Collection
The entrance is composed of the fare collection area including sales kiosks for purchasing tickets and validation, the fare collection equipment such as fare gates and turnstiles, and system information including maps. Ideally it is weather protected and lockable after hours.
The fare collection area will require:
- ways for staff to communicate with passengers, both visual and through speech: grills, speakers, microphones, induction loops, and lip reading for the hearing impaired
- cash trays, cash drawers, a drop safe, and possibly credit card readers
- to be protected to secure money transactions
- ergonomic design, and air conditioning and/or heating subject to climate
- storage facilities for supplies, including cleaning supplies, and a water tap
- storage facilities such as lockers for the staff, as well as (in some cases) a staff toilet.
Because this is the electronic nucleus of the station, considerations for power supply and back-up power will need to be put here, and cables included in the station foundation design. The sales information and the ticket validation equipment will all need electricity to power it and transmission equipment to communicate that information to a control center. A local server may need to be stored here with proper ventilation. If there is a real time passenger information system, it will need power as well and be linked to the system to give that information. Power may also need to be supplied to the doors at the entrances and the where the buses dock, as well as the interior lighting. Fire detection and alarm systems will also need to be incorporated. At a minimum, an extinguisher is to be stored in the kiosk.
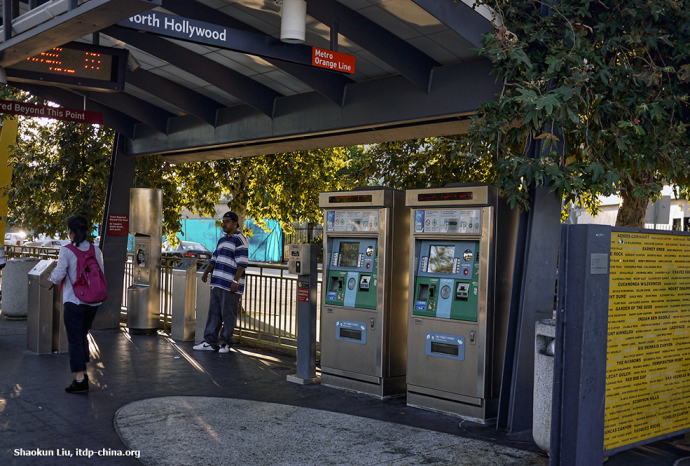
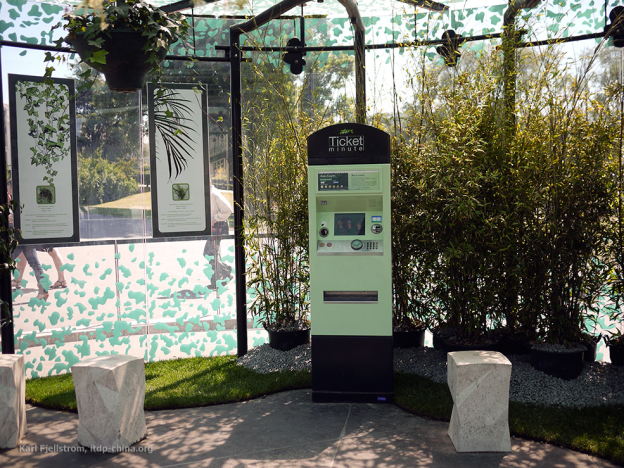
Point of sale (POS) Terminals
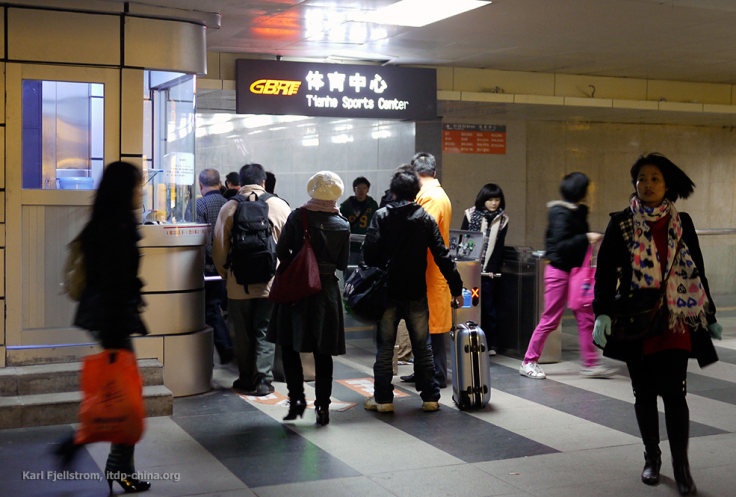
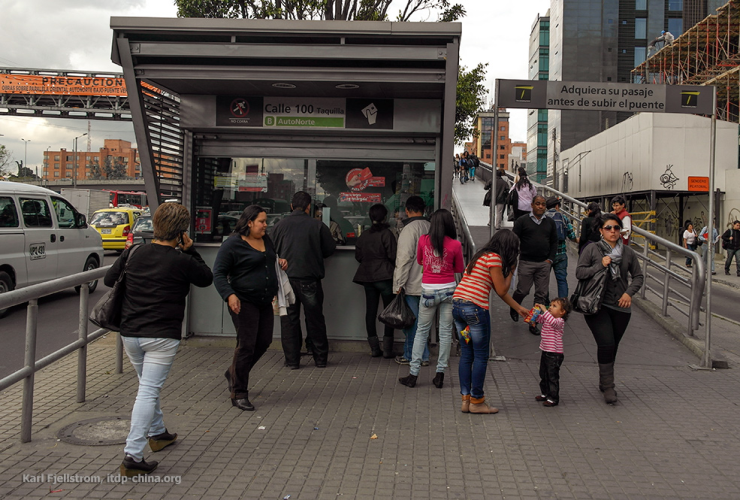
There needs to be sufficient point of sales (POS) terminals at each station to handle the level of customers. With an insufficient number of POS terminals there can be major queuing problems at high volume stations.
It is not recommended to sell tickets or cards at the station platform, because with sales, comes queues. Queueing on the platform presents many problems because of space limitations and the challenges to circulation. Therefore, selling and recharging cards / tickets at shops or at POS kiosks on pedestrian access bridges is better than selling them on the platform and should be encouraged as much as possible.
To avoid any queuing, there should be one POS terminal for every 500 boarding customers. To minimize the system costs and maximize profits, however, one POS terminal for every 2,000 customers is closer to optimum. The personnel costs are expensive, and a certain amount of queuing at the beginning is normal and will create an incentive for customers to buy multi-trip tickets. For this reason, we recommend one new POS terminal should be added for each 1,000 boarding passengers per peak hour, unless the level of usage of smart cards is very high and the cash payment in the station does not allow change to be given. In this case, where smart card usage is very high and where change is not provided in the station, one POS terminal for every 3,000 passengers can suffice.
This figure is derived as follows. One selling operation normally takes about 6 to 10 seconds, averaging 8 seconds. Thus, on average a POS terminal will have a capacity 450 customers per hour. Not everybody will be buying tickets, however, as many will already have multi- trip tickets. It is difficult to predict how many tickets the average customer will ultimately buy in any given system. In TransMilenio the average ticket buyer buys 4.2 trips. So, a POS terminal is really only necessary for every 450 * 4.2 or 1,890 passengers boarding per hour. However, this figure may be different in other cities, so to be reasonably sure that serious queuing will not result, one POS terminal for every 1,500 boarding passengers per hour per station is suggested. While at least one of the POS terminals should be manually operated, some of the additional ticketing system POS terminals can be automated.
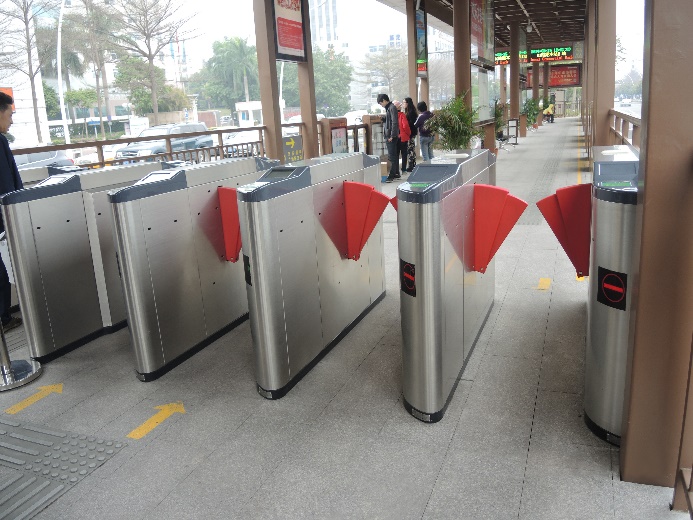
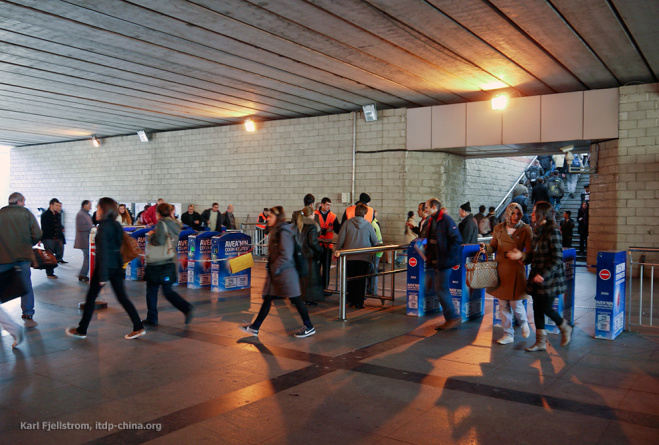
Entry and Exit Turnstiles
At the BRT stations along the corridor, normally the turnstiles have higher capacity than the POS terminals, but they are used by all the customers. Normally the gates have a capacity of 900 to 1,200 customers per hour, or 3 to 4 seconds per customers. Because sometimes the ticket gates fail, it is usually good to have one or more back up turnstiles to plan for redundancy in the system. For systems with a flat fare, to keep open the possibility of a distance-based fare, there needs to be a minimum of one gate per every 1,000 boarding passengers and one gate per every 1,000 alighting passengers, but with a minimum of at least one additional gate per direction in case of a turnstile failure.
The following are rules of thumb for processing rates:
- 2,000 people per hour can move within a meter of space.
- 900 people per hour (PPH) can enter a station through a single smart-card turnstile. The number rarely is that high as machine and human error can drop that rate to 600 PPH, if not lower. This is also contingent on the technology. This can be used as a rule of thumb, but then should be verified against real counts of the actual technology.
- 1,500 PPH can exit a station through a single turnstile if they do not have to scan a card, but just pass through.
- 3,300 PPH can enter or exit a station with no barrier. The older the population, the slower the speed, the lower the rate.
- Two people will wait in one square meter of space, while three people will wait in queues in a square meter of space.
- People avoid walking too close to walls, fences and the curb. Thus a 0.3-0.5 meter shy distance is included in any width calculation.
- Processing rates for ticket vending also need to be accounted for. There will always be lines for ticket procurement and the processing rates depend on whether machine kiosks are used, if you can buy multiple tickets or fares at once, or if you have to buy a ticket from a person.
- Always have a contingency or redundancy plan for broken equipment, staffing issues, etc.
Space on station is precious and every function that can be done in other places should be avoided and removed, including rest rooms, ticket selling, and equipment that is not directly related to operation.
25.7.3Number of Gates, ticket machines or boots
The equation bellow is general for detemine the required number of units of boots, turnstiles, gates without queue formation:
\[ N = integer( {Q \over C} + 1.5) + R \]
- \( N \): Number of units needed
- \( Q \): Quantity of required peak hour operations
- \( C \): Average Capacity per unit (operations/hour)
\( 1.5 \):
- \( 0.5 \): Spare capacity to avoid random queues
- \( 1.0 \): Rounding up, to never have less than 0.5 of spare capacity
- \( R\) : Reserve for failure, minimum of 1. If reversible gates are used, R can be added after adding entry and exit gates.
In case of two entries and no information about flows adopt 0.70 of total for each side.
Parameter for number of operations and capacity for gates, ticket machines
Ticket machine:
\( Q = {Max(Pb,Pa) \over Nt} \), where
- \( Nt \): average number of ticket trips bought per sale operation. In absence of data adopt 4
- \( Pa \): total alighting passengers on peak
- \( Pb \): total boarding passengers on peak
- C = 180
Ticket boot:
- same as ticket machine
- but \( C = 400 \)
Entrance gate: turnstile with contactless card
- \( Q \): total boarding
- \( C = 900 \)
Exit gate: turnstile with contacless card
- \( Q \): total alight
- \( C = 900 \)
Exit gate: turnstile without card (free exit)
- \( Q \): total alight
- \( C = 1800 \)
Exit without turnstyle
- \( Q \): total alight
- \( C = 3000 / m^2 \)
Exit gate without turnstile but with contact point to discount
- \( Q \): total alight
- \( C = 1400 \)
Compute separately morning and evening peak and adopt maximum for each.
However, in case of reversible gates (which may provide economy of space and equipment), compute the maximum required gates for each period without considering reserves for failure:
\[ G_\text{TOTAL} = max(\text{G}_\text{ENTER MORNING} + \text{G}_\text{EXIT MORNING}, \text{G}_\text{ENTER AFTERNOON} + \text{G}_\text{EXIT AFTERNOON}) \]
Then, compute the maximum of entrance gates (\(M_{EXIT}\)) of all periods (without reserve for failure \( R \)) and the maximum of exit gates (of all periods except reserve for failure \( R \)):
\( M_\text{ENTER} = max(\text{G}_\text{ENTER MORNING} + \text{G}_\text{ENTER AFTERNOON}) \) \( M_\text{EXIT} = max(\text{G}_\text{EXIT AFTERNOON} + \text{G}_\text{EXIT AFTERNOON}) \)
Then, the number of entrance, exit and , will be as follows:
\( G_\text{REVERSIBLE} = \text{M}_\text{ENTER} + \text{M}_\text{EXIT} - G_\text{TOTAL} \) \( G_\text{ENTER} = \text{M}_\text{ENTER} - \text{G}_\text{REVERSIBLE} \) \( G_\text{EXIT} = \text{M}_\text{EXIT} - \text{G}_\text{REVERSIBLE} \)
Reserve gates, computed over total, should be reversible
Box 25.3 Finding out how many gates are required
Table 25.5Example of number of required gates computation
| period and number of gates needed | |||
|---|---|---|---|
| peak | boarding | alighting | total |
| morning | 3 | 7 | 10 |
| evening | 5 | 3 | 8 |
| maximum | 5 | 7 | 10 |
\( G_\text{REVERSIBLE} = \text{M}_\text{ENTER} + \text{M}_\text{EXIT} - G_\text{TOTAL} \) \( G_\text{ENTER} = \text{M}_\text{ENTER} - \text{G}_\text{REVERSIBLE} \) \( G_\text{EXIT} = \text{M}_\text{EXIT} - \text{G}_\text{REVERSIBLE} \)
\( G_\text{TOTAL} = 10 \) \( M_\text{ENTER} = 7 \) \( M_\text{EXIT} = 5 \) \( G_\text{REVERSIBLE} = 7 + 5 - 10 =2 \) \( G_\text{ENTER} = 7-2 = 5 \) \( G_\text{EXIT} = 5-2 = 3 \)
Ten operating gates are required, with one resversible as reserve
\[ Total = 10 + 1 = 11 \]
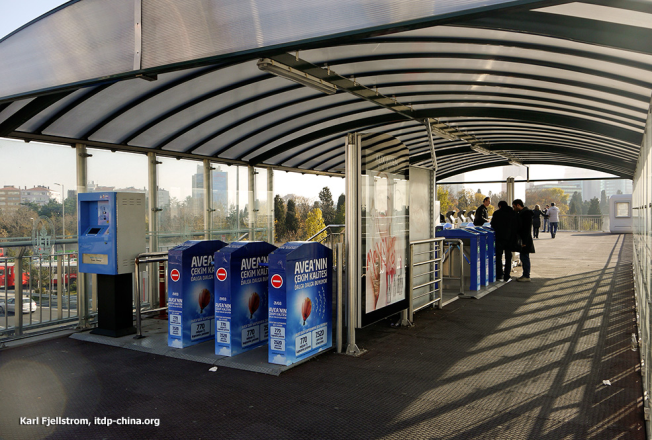
25.7.4Layout and Placement of Turnstiles
Turnstiles can be offset or placed directly across the entry of the station. Offsetting the turnstiles allows for more turnstiles but requires more station length. Figure 25.62 provides examples of various turnstile/gate configurations.
Since space inside the station is limited, fare collection can sometimes take place outside the BRT platform. Examples of off-platform fare collection and POS location are provided in Figure 25.67.
25.7.5Platform Waiting and Circulation Areas
Waiting areas in stations with doors in both sides of the station should generally be offset so that boarding doors do not directly face each other. Otherwise, waiting as well as alighting passengers can come into conflict as they try to crowd into the same space.
25.7.6Wayfinding
A station wayfinding strategy is necessary to help people quickly and intuitively identify where they are and where they are trying to go, how and where to get on the bus or make transfers, and where to access station services. The most effective wayfinding strategy is achieved through a combination of station design and signage (see Information and Customer Service below and Chapter 28: Multi-modal Access).
Four principles of wayfinding are:
- Intuitive;
- Legible;
- Consistent; and
- Extensive.
Wayfinding is typically provided via static signage, but may also utilize real-time information screens. Increasingly, passengers use their own hand-held devices for navigation. At transfer stations in particular, signage should be sufficiently sized and eye-catching in order to effectively lead customers to the right location. System designers should walk through the likely steps of a prospective customer in order to place the signage at the correct point. For example, signage directing customers to transfer points may be best placed directly across from the exit points of alighting customers.
In addition to providing directional and location information, other informational signage in and around stations should also be provided to help customers readily understand the system. This signage could include:
- Station entry and exit points;
- Waiting location for particular routes (if multiple docking bays);
- Directions for making transfers;
- Directions to station services (tickets, bicycle parking, restrooms); and
- Actions required in the event of emergencies (instructions for call boxes, fire suppressing equipment, etc.).
Signage allows the customer to immediately identify the system and can be an important element of the wider marketing effort.
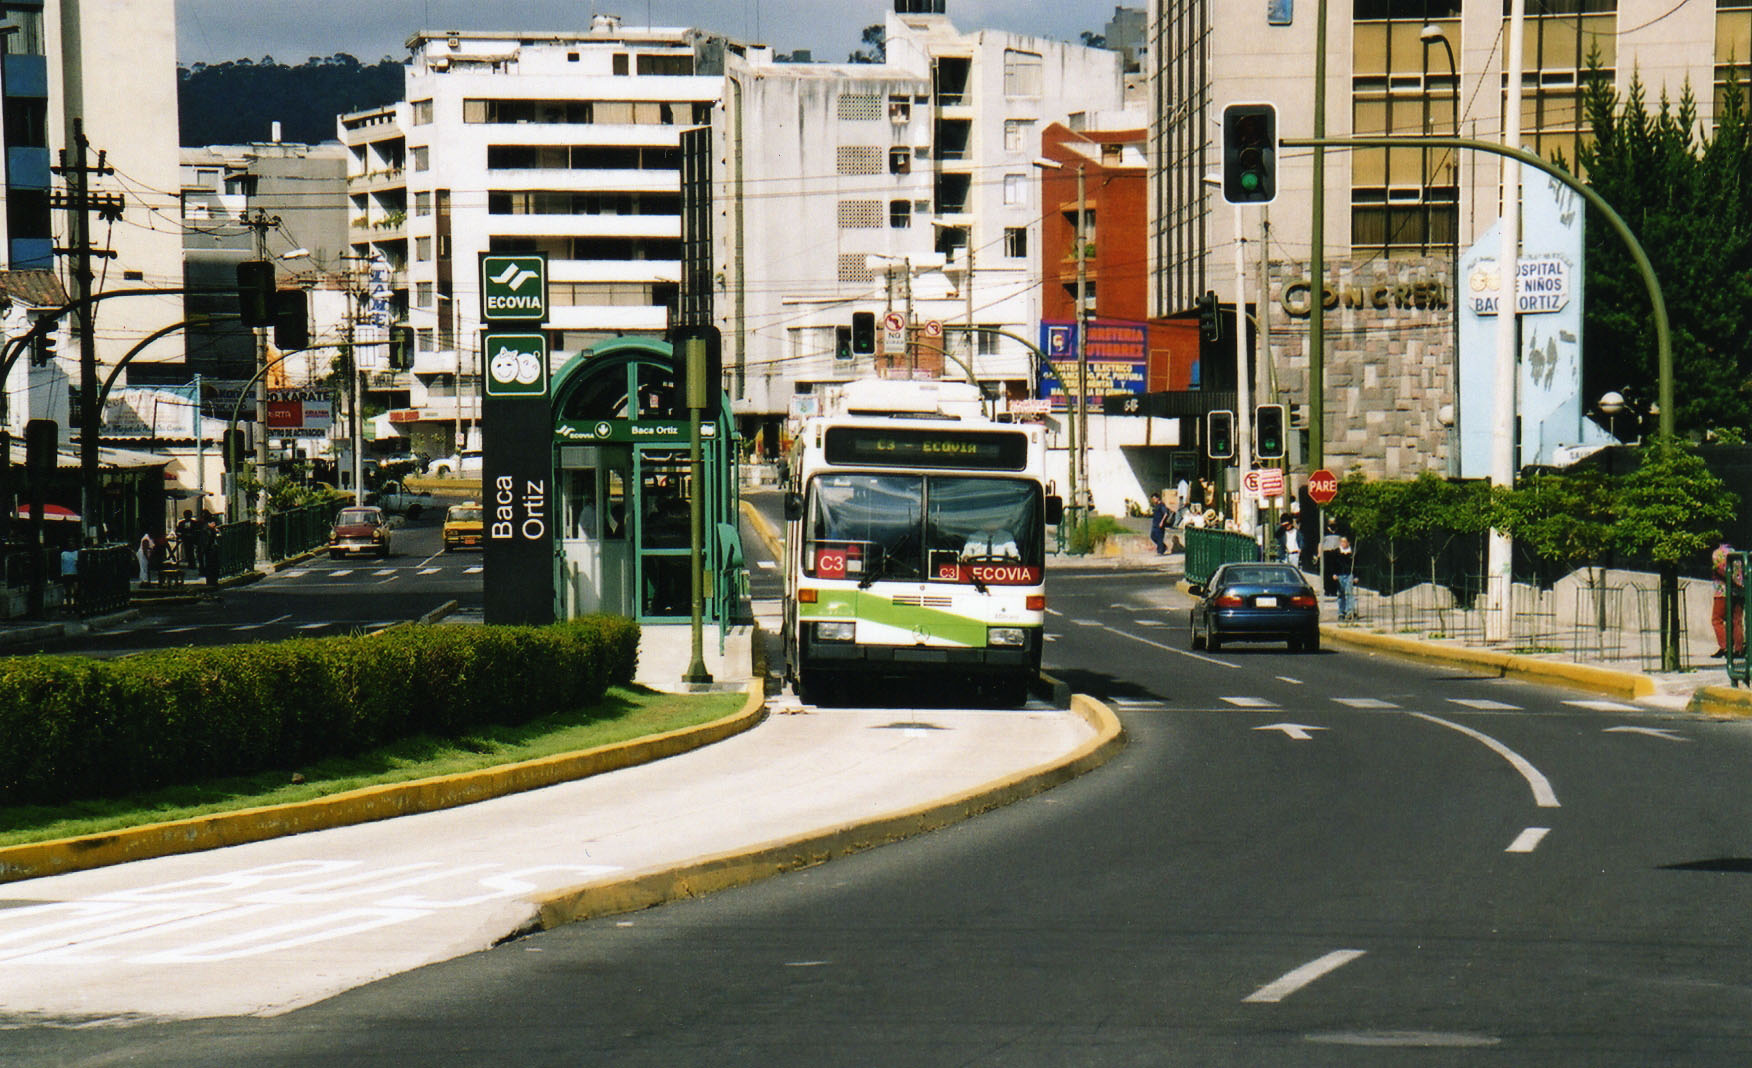
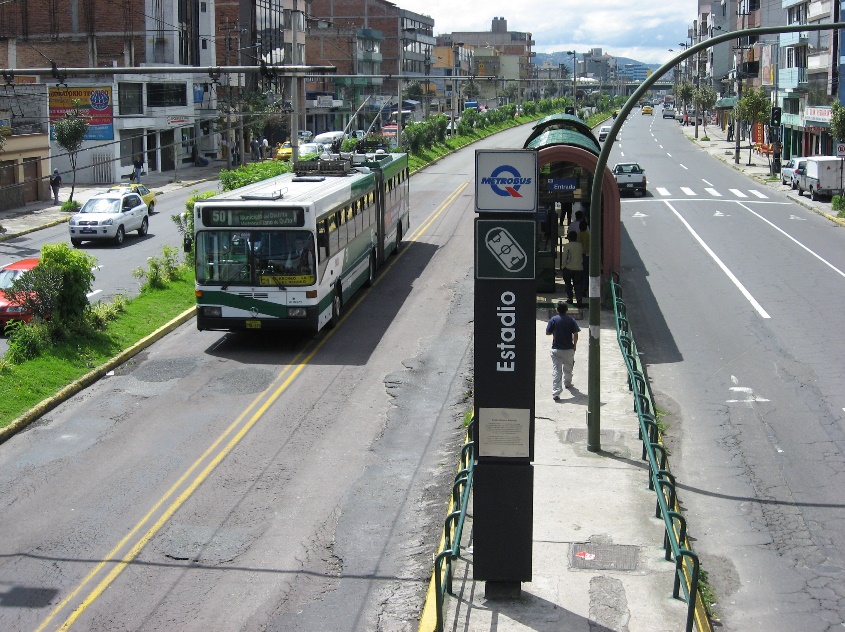
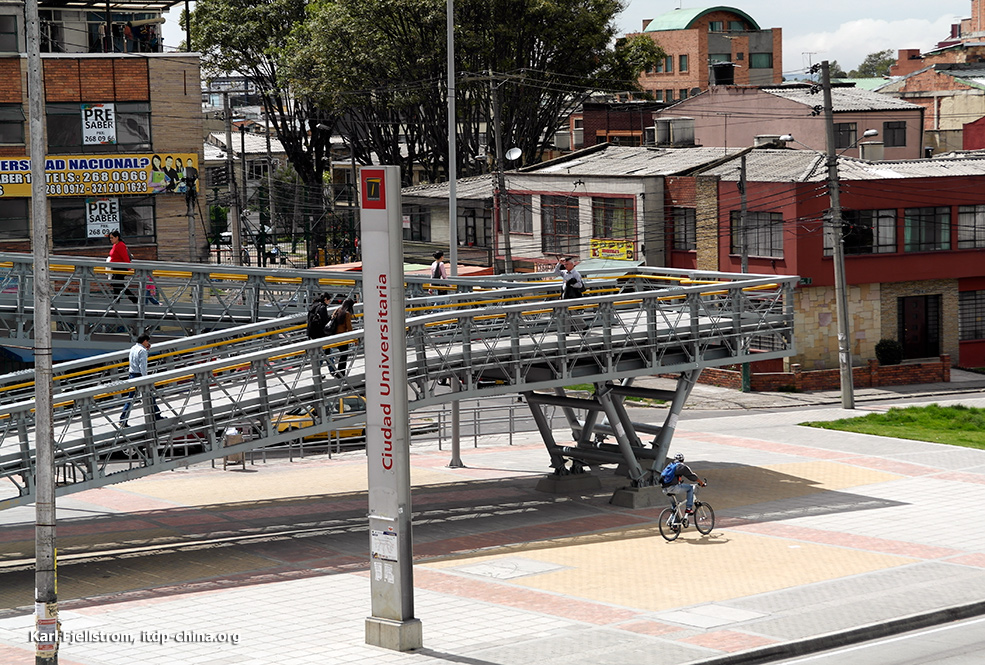
The height of the signage post will be a principal factor in creating a sight line that is visible from a great distance. The color and letter size on the post will also determine recognition levels (Figure 11.64). Typically, the name and logo of the system will be prominently displayed on the sign-post, along with the name of the particular station.
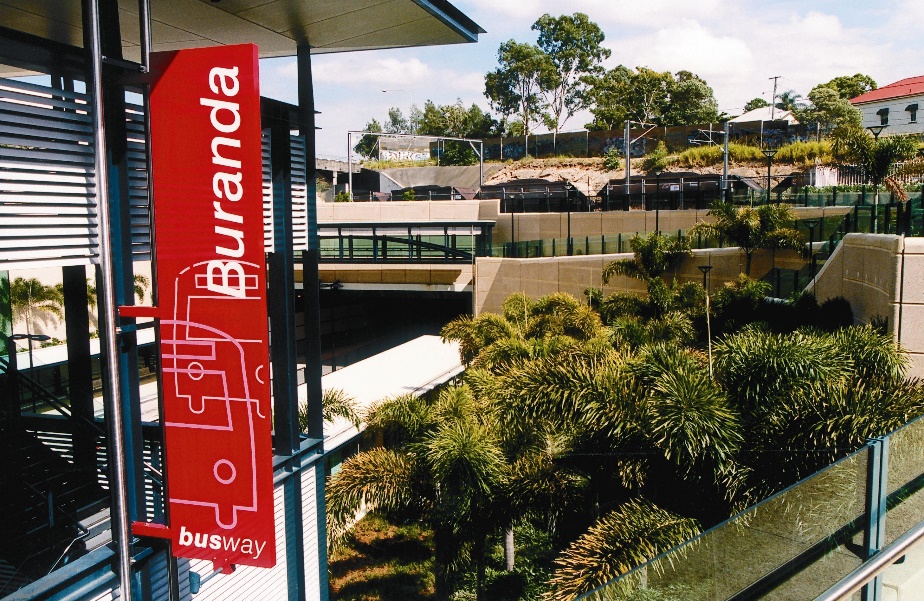
An image related to the particular station may also be displayed on the sign-post. Such visual imagery helps passengers to quickly recognise their destination. The name of a hospital, university, or zoo may not mean anything to some passengers (especially occasional visitors), and thus a representative drawing may provide more immediate recognition.
The sign-post may also include other pertinent information. However, at the same time, designers must avoid placing too much information on the posts. Visual clutter will reduce the overall objective of allowing customers to quickly recognise a station’s location.
25.7.7ITS Components
In-station intelligent transportation system (ITS) components at minimum will usually include:
- Operating and dispatch system. This includes cameras connected to the control center, broadcasting announcements, screens showing the next-bus arrival information, and some of the equipment inside the ticketing kiosk;
- Automated fare collection (AFC) system. This consists of the turnstiles or gates and related cables, as well as equipment in the ticketing kiosk; and
- Sliding door system for the station. This consists of the sliding doors themselves, plus controls from inside the ticketing kiosk and related cabling.
All of these components rely on or interact with various subsystems, such as clock synchronization, UPS power supply, IP digital broadcasting, vehicle localization, dispatch management, and so on.
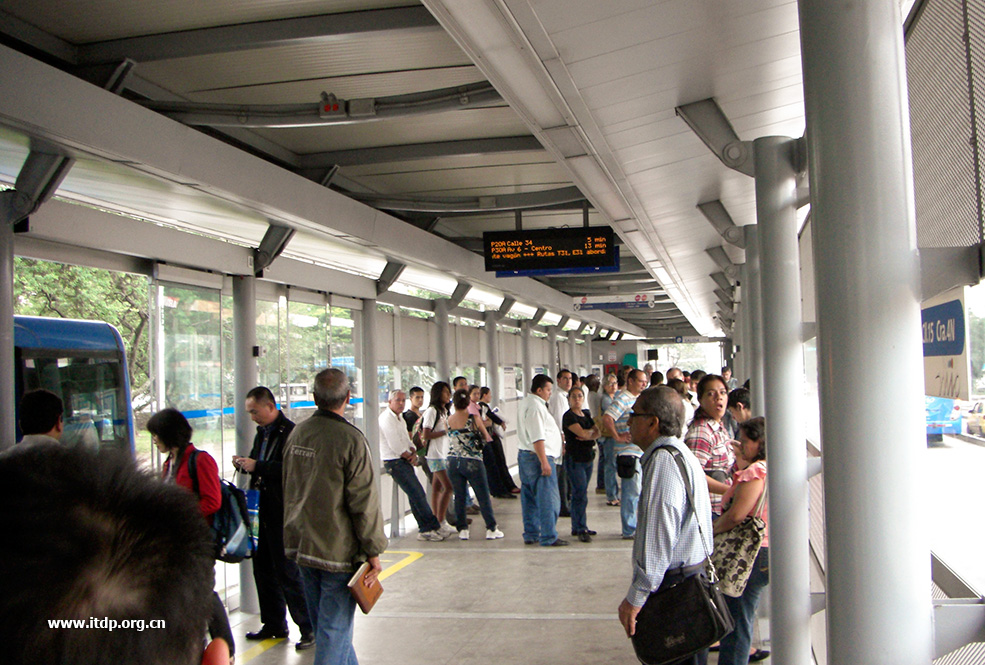
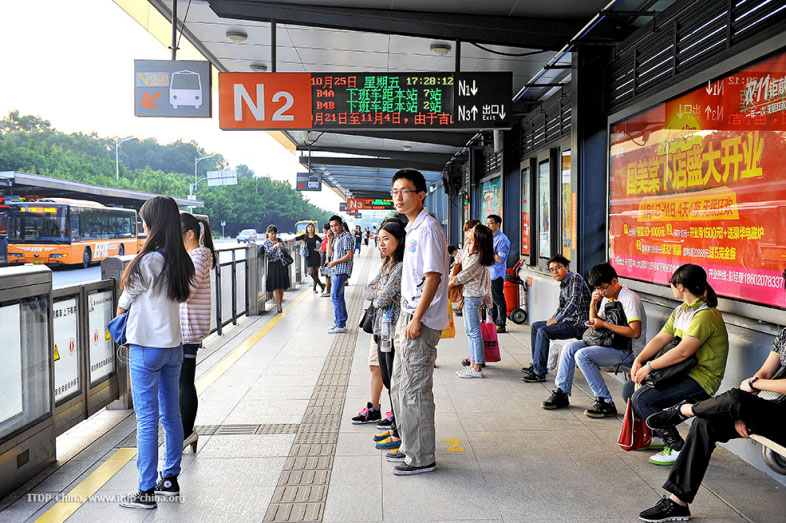
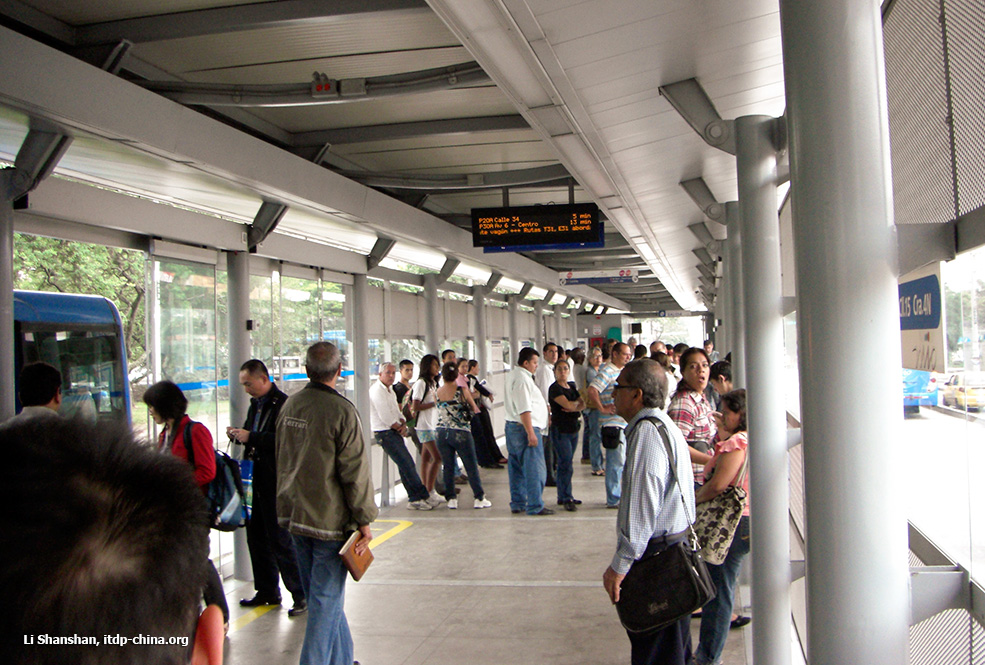
One of the most important technological developments for transit riders in recent years has been the availability of real-time arrival information. This information helps to reduce customer “waiting stress,” which affects passengers when they do not know when or if a particular bus is going to arrive. A monitor can be mounted adjacent to the waiting area. Besides arrival information, other important news such as route changes, system delays, and scheduled maintenance can also be displayed. Vehicle-arrival status can be displayed outside the BRT station as well. Passengers who know that they have sufficient time until their vehicle arrives may choose to run an errand in the meantime.
Sliding doors are also increasingly used in BRT systems. The height of the sliding door is normally 1.1 - 1.3 meters, and the opening width of the door is 1.35 - 1.8 meters depending on the type of vehicles needing to stop at the station. The sliding door is activated by a sensor which is installed inside the vehicle, and when the driver stops the vehicle at the station and opens the door, the related sliding door at the station will automatically open for passengers boarding and alighting. The second level of control is in the control room of each station to open the sliding door in case the sensor in the vehicle fails to activate the sliding door. And as third level of control, if the sliding door cannot be activated by the other ways, the station attendant can use a remote controller to activate the sliding door. Maintenance and upkeep of sliding doors has proven to be a problem. The more technology or moving parts introduced, the more likely that they will need to be fixed.
25.7.8Seating
Seating provides a resting space while customers wait, particularly the elderly and disabled. Seating can range from formal benches to simple leaning posts. The need for benches may vary based on the headways - if vehicle headways are infrequent, then more people will want to sit. In direct service systems, customers tend to wait for longer periods in the station as they wait for a particular route, in contrast to trunk-feeder systems. Some form of station seating or at least leaning is essential in such systems. The leaning bars and seating are effective ways of encouraging passengers not to wait in front of the gates, which can impede boarding and alighting. This is especially important in Lima and Cali, which have only one stopping area per sub-stop.