5.4Additional Corridors Based on Future Demand
Prediction is difficult, especially about the future.Yogi Berra, former baseball player, 1925–2015
There are cases in which corridors without existing bus routes, or with existing bus routes with low demand, may still be good BRT corridors. There are four main reasons for this:
- Route Shift: Some trips may shift from nearby public transit routes;
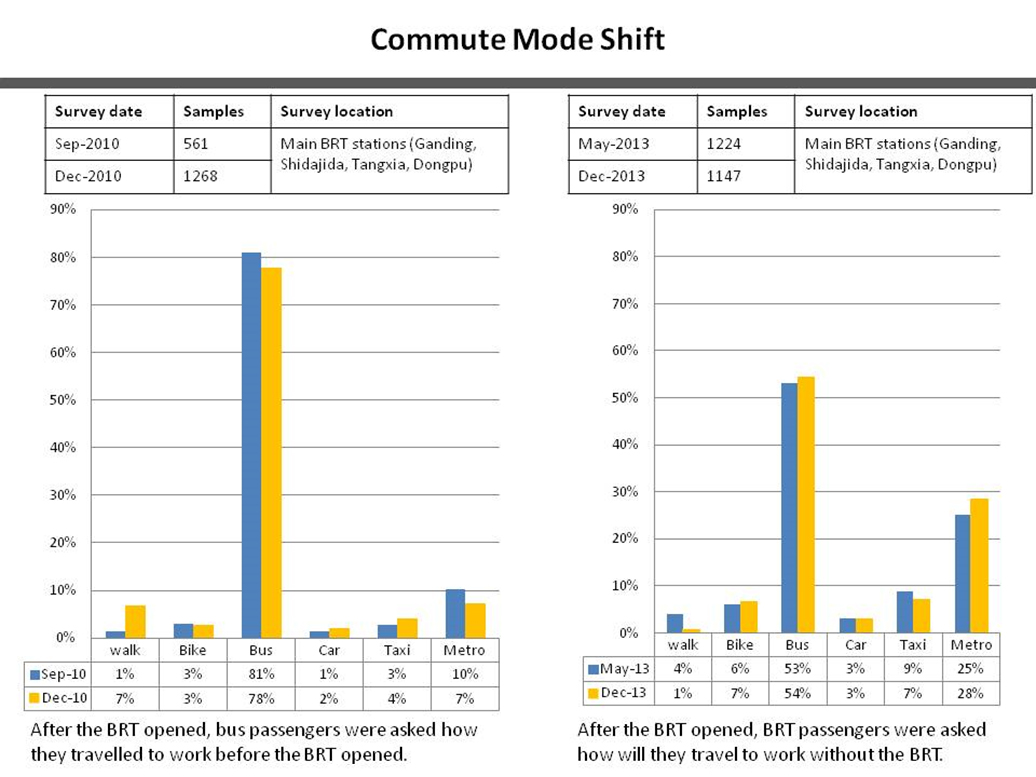
- Mode Shift: Some customers may be new to public transport due to the dramatic service improvements that BRT can offer;
- Land Use Changes: Land use may change, generating new trips altogether, or BRT can be used to help stimulate land use changes;
- Downtown Infiltration: BRT may provide a new link into a city’s downtown, where public or private buses were not previously permitted to go.
Transit ridership during the first year of operation, however, is difficult to predict with any accuracy. Hence, future projections of this type are subject to interpretation and manipulation. As such, it is wise not to put too much stock in any hard numbers with regard to projected future ridership. It is also a good idea to require that all assumptions used to predict future ridership be presented to stakeholders in their raw form rather than merely processing the data and burying it in a multi-criteria analysis. This might include:
- Service plan assumptions;
- Speeds on BRT links;
- Source of all origin-destination data;
- Land use change assumptions;
- Mode-specific constants;
- Transfer, walking, and waiting penalties.
Now we will delve into further detail about how best to estimate future ridership based on the three categories: route shift, mode shift, and land use changes.
5.4.1Route Shift
Sometimes a new BRT is built that provides a new or faster public transport link for existing customers. This might be because the BRT offers faster services than parallel bus routes, or because it offers new routes that cover a shorter distance than the previous routes. Such new routes may even eliminate a previously necessary transfer. It is difficult to predict such route shifts without a model.
A public transport model gives us the ability to insert a new public transport link, perhaps at higher speeds than the existing links, and see how many customers make the switch. Unlike modal shift (see below), public transport customers have already made the decision to use public transport, and are therefore most likely to choose the corridor/service that provides the fastest trip, even if it is new.
Modeling route shifts requires a complete set of transit data about existing conditions, including existing ridership and speeds on all public transport routes. Ideally, there will also be an existing origin-destination matrix indicating the boarding and alighting stations of all public transport. If not, one should be created and include transfer data as well.
In order to ensure a fair comparison between corridors modeled from route shift and corridors selected from the demand analysis, the model should be run as if the BRT were opening today, without accounting for any future system growth. Once the model has been run, the maximum pphpd on the modeled corridor should be extracted from the results. Demand is usually highly elastic, so an increase in the price of the service may significantly reduce demand. This needs to be factored in when modeling demand from route shift, unless all these are consistent between the two services.
Because a BRT corridor is estimated to gain a significant percentage increase in ridership over existing conditions, one must decrease the maximum pphpd identified by the corresponding percentage, so that the corridor may be comparable to the other corridors selected in the existing conditions analysis.
5.4.2Mode Shift
When a new high-quality public transport corridor is built, such as BRT, some people who currently drive may switch over to public transport. This might be because the BRT is faster or more convenient than driving, or because parking is difficult or expensive and the BRT represents a less costly option. Many cities, particularly in developed-world contexts, invest in transit precisely to lower auto use and fundamentally change travel patterns.
It is difficult to model modal shift. Often, it is based on a four-step model that begins with a household survey and a mode choice analysis. This can be quite complex and can hide many important assumptions. Indeed, many models that have predicted a high mode shift have been significantly overestimated.
A BRT corridor cannot be selected based primarily on the assumption that it will lure people out of their cars. This could take many years and could result in empty buses until this goal is realized. Instead, it is safer and more realistic to plan for corridors where existing demand and bus service already exist. This way, BRT corridors are selected where there is certain to be ridership and some modal shift is a good possibility.
International experience has shown a range of percentage increases above existing ridership due to modal shift. In Rio de Janeiro, 5 percent of the people surveyed for the TransOeste Impact Study said they had shifted from car use to the BRT in the system’s first nine months of operation. Likewise, in Mexico City, 17 percent of Metrobús customers left their cars for BRT. According to Metrobús, that percentage translates to 122,000 fewer car trips every day.
However, because it is best to apply the mode shift increase to corridors with existing high demand, it is just as well to leave the corridors prioritized as is and, once built, make efforts to attract people to use the new system rather than cars.
5.4.3Land Use Changes
There are two reasons why a BRT might be built where land use is changing. First, rapid urban revitalization in a certain area might not be reflected in the existing transit services and, if dense enough, is likely to need a high-capacity public transport link in order to discourage auto use from the start. Second, a growing number of cities, particularly in the United States, are looking to BRT as a tool to stimulate urban revitalization and transit-oriented land development. In either of these cases, it might be worth considering BRT in order to serve the newly developed land. First, we describe how to determine if these conditions are met, and second, we describe how to create a BRT corridor in order to serve these changes.
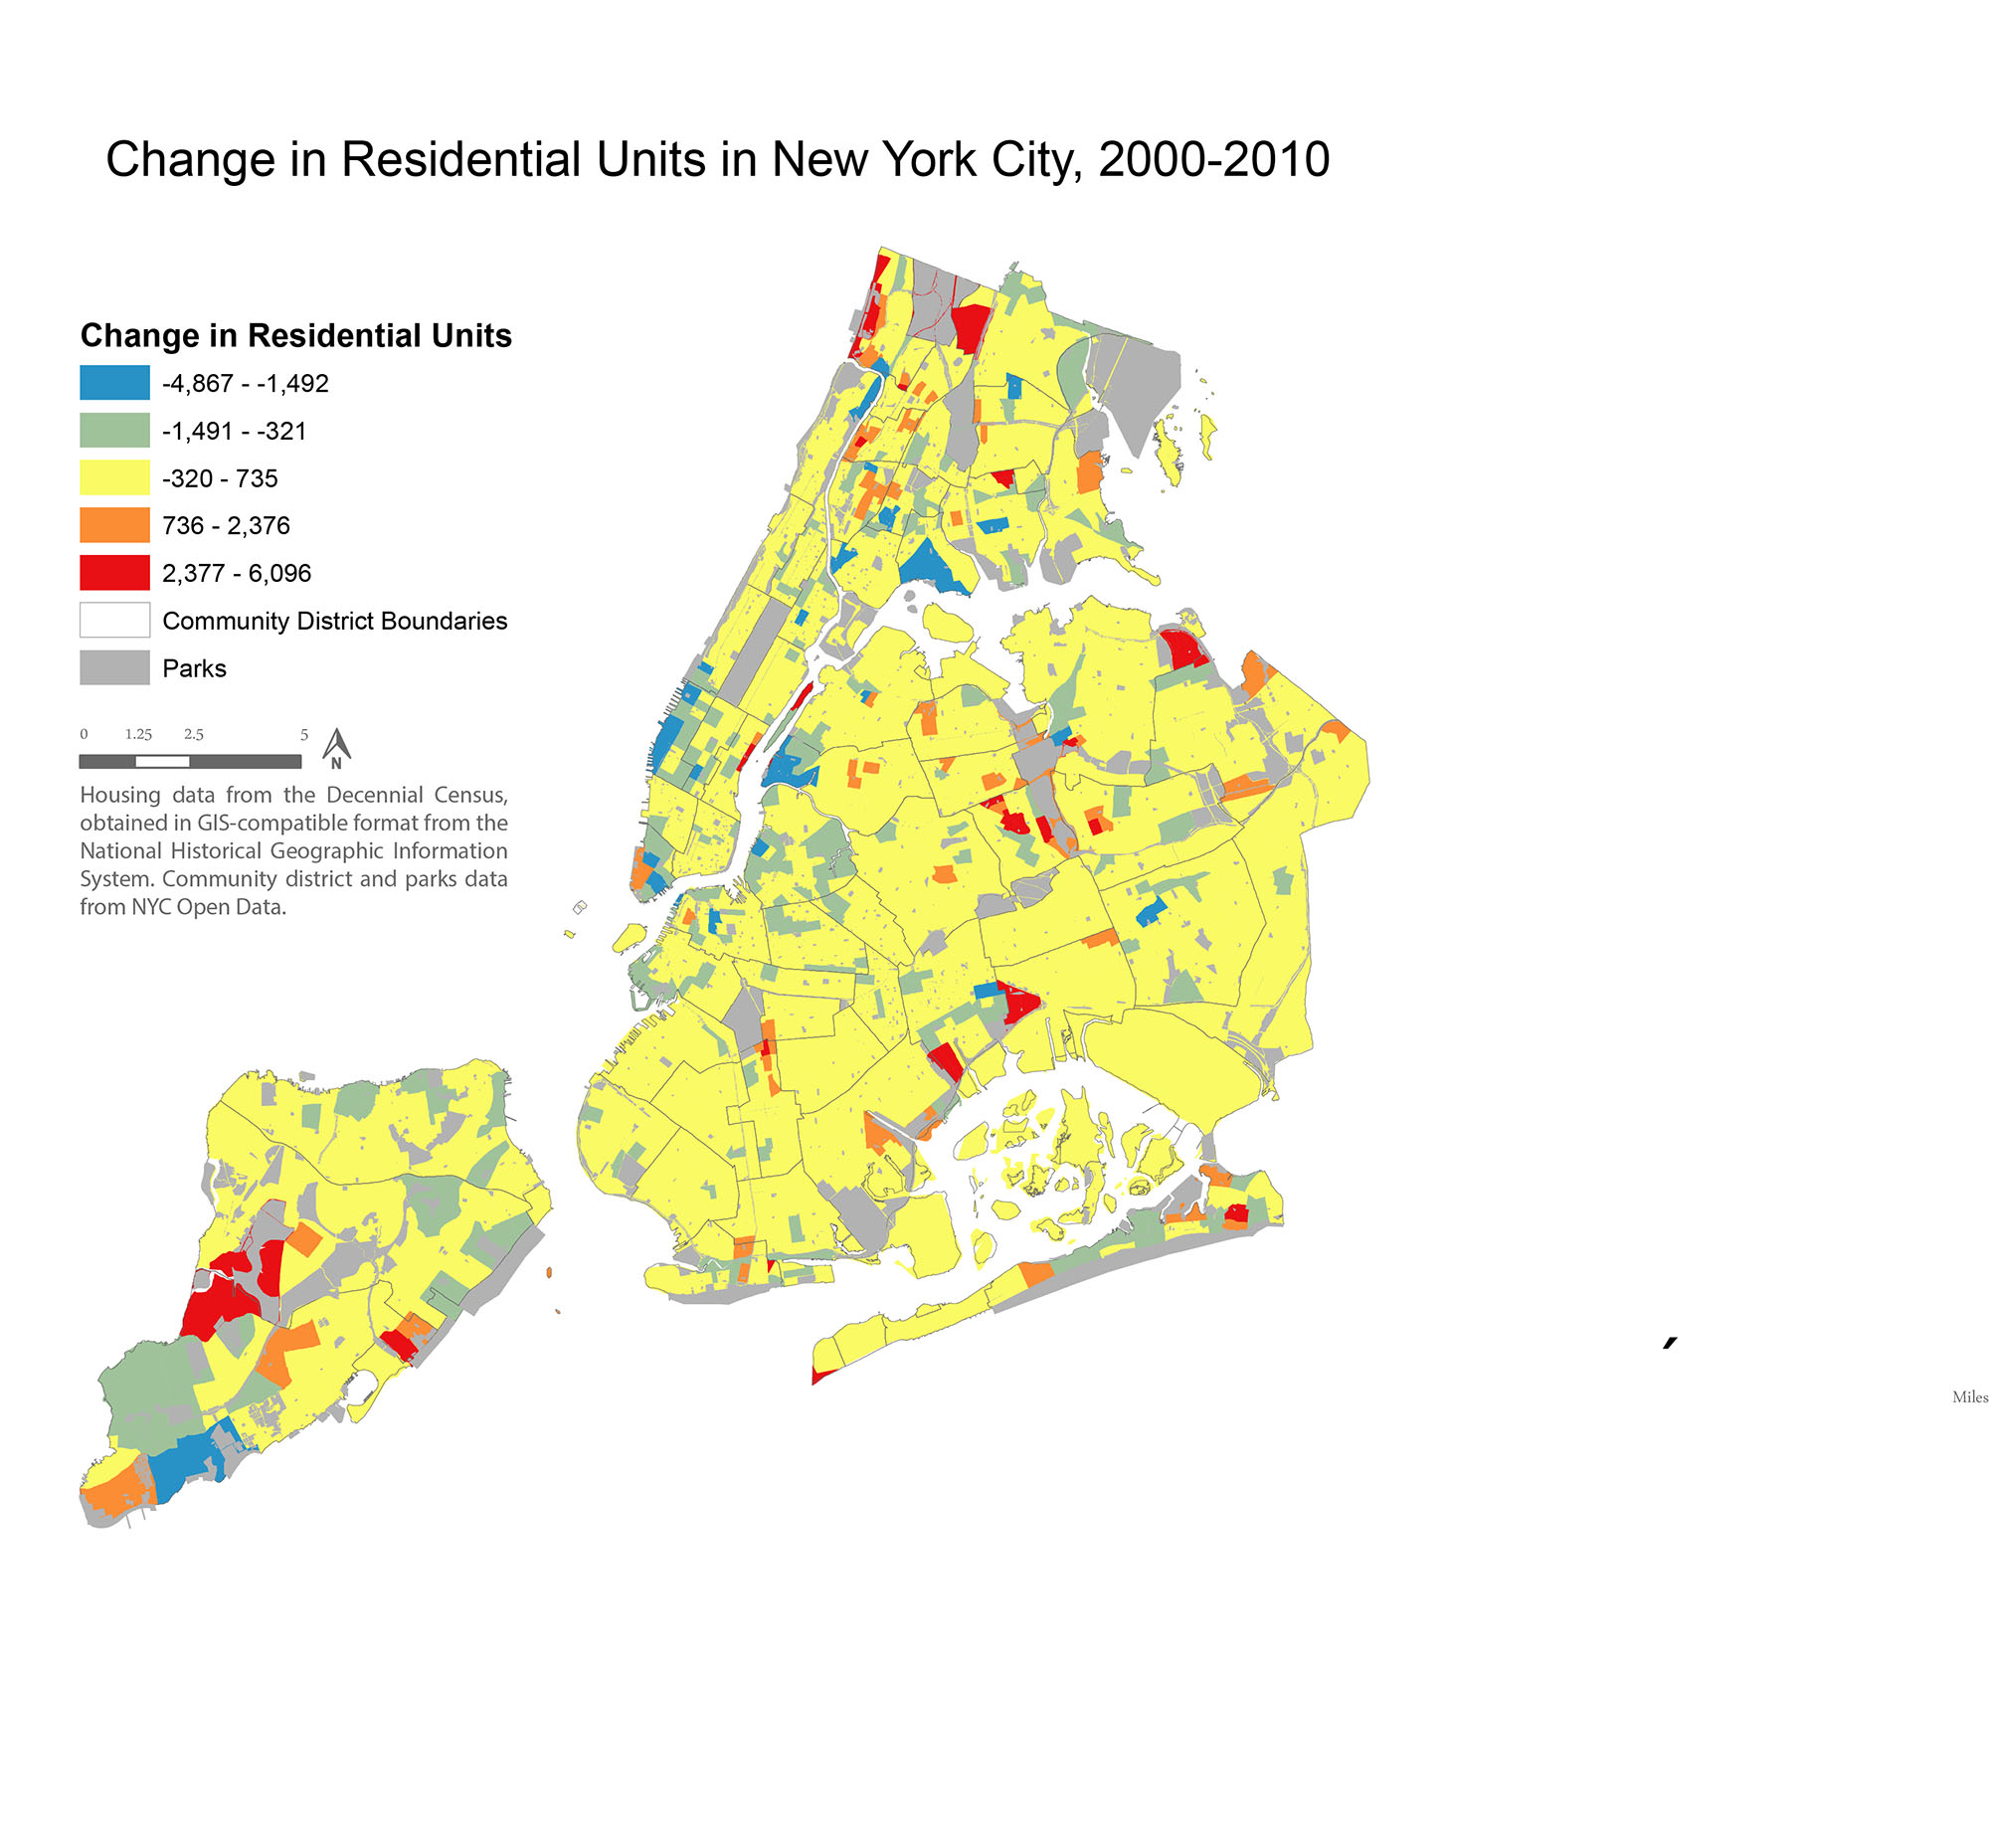
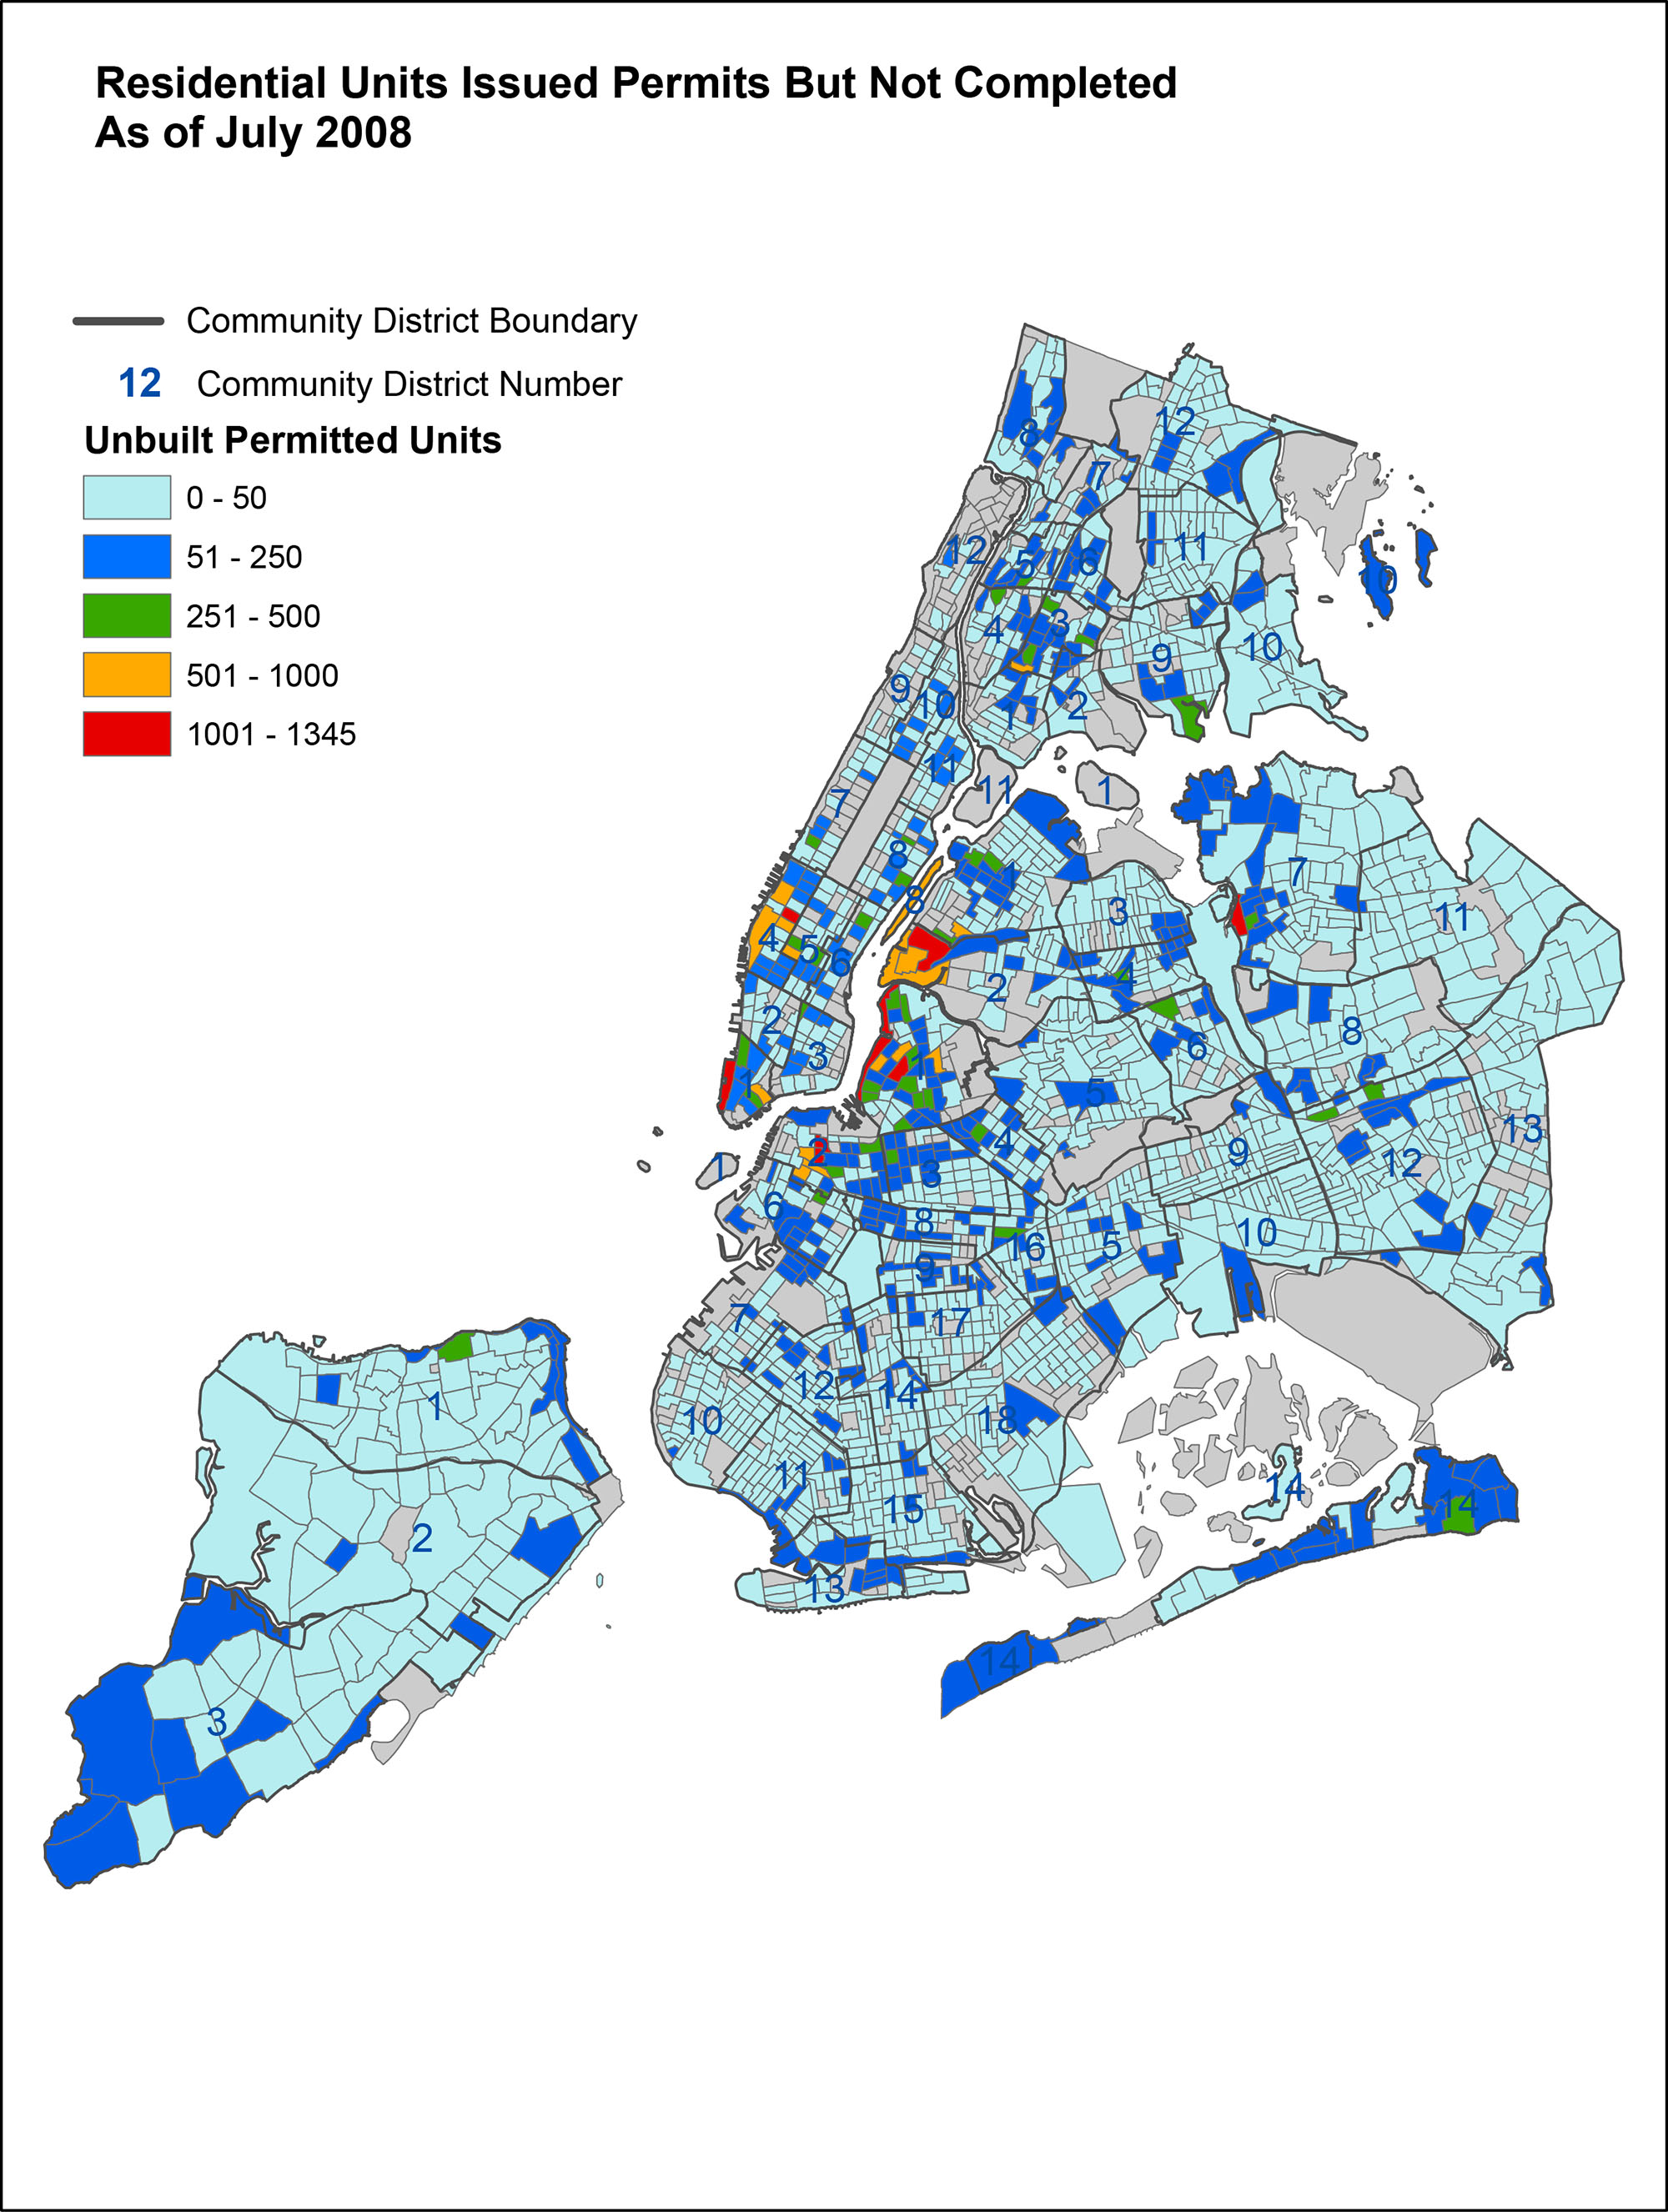
To determine where land is developing and no transit has yet been designed to serve the new development, one should look at net changes in housing and commercial units over the past ten years (Figure 5.18). This information can sometimes be collected from the census or from other sources. Another good source of data is to look at building permits issued but not constructed as a guide to where new development is likely to take place (Figure 5.19). Sometimes these can be collected from the planning department or the buildings department of the municipality. This data about recent existing trends in real estate development is likely to be continued to some extent over the next decade. This grounds future projections on land use changes in reasonably transparent empirical data.
In addition to using BRT to serve development that is already occurring, BRT is more and more commonly being used to help stimulate development in designated areas. A recent study conducted by ITDP analyzing transit corridors throughout North America found that if BRT is built in the right corridor and the government institutes policies that encourage development around that corridor, there is a strong chance that the land along the corridor will attract development. However, using BRT to drive development is not enough. BRT planning, when premised on development, must be directly linked to government development initiatives.
Often, local planning and urban development authorities have a fairly good sense of where they want to develop, what new development is likely, and where they have been approached by developers asking for zoning variances or other support from the municipality. Sometimes planning authorities have regulatory structures that guide new development in specific areas through spatial development plans, and they may have a good sense of the likely time frame for these developments. So if one of the purposes of BRT corridor selection is to simulate development, information regarding the government’s development plans should be collected and the locations should be mapped.
There are integrated transportation and land use models available, some of them open source like Tranus, which provide more sophisticated modeling tools for predicting future land use changes and hence are able to provide more robust future demand projections than traditional four-step travel demand models. These models generally rely on census-tract-level changes in population and employment as a baseline, and then supplement their future demand projections with additional data sources. In our experience these models are quite difficult to use and require a significant amount of data that is difficult to collect. It is preferable that all of the basic information described above be presented to stakeholder groups in the form of a map to serve as a guide for the BRT corridor selection.
Once all of the information has been mapped and presented, planners must determine how areas of new development can be linked to BRT corridor selection. An underdeveloped area on its own, even if in the process of being developed, is unlikely to be able to support a BRT, particularly if the BRT serves only that area and does not connect with other sectors of the city. It is much better to link areas of new development to transit corridors with already high demand, as this is more likely to provide a useful connection to the people moving into or working in the new development areas. Additionally, in the years during which the development is occurring, the BRT corridor will still be relatively successful due to its serving areas of already high demand.
Ideally, a BRT corridor proposed to serve a new development will be close to existing high demand corridors, because the link between existing high demand and newly developing areas will be short so if buses are empty for a while, it will only be for a short link. Second, studies have found that the closer a new development area is to existing activity, the more likely it will be to develop.
5.4.4Integrating the Downtown
Sometimes preexisting bus routes stop just short of a city’s downtown. This is rarely due to low demand in the downtown. Instead, it is often simply government policy to keep buses out of the downtown core. In fact, most cities’ downtowns are still where the majority of trips end in the morning and begin in the afternoon. It is almost always the case that providing a city’s downtown with Gold Standard BRT will increase the demand on the BRT as a whole. It is possible to prove this with a demand model; however, it is generally not necessary to model such a situation since in nearly all cases, it turns out to be true.
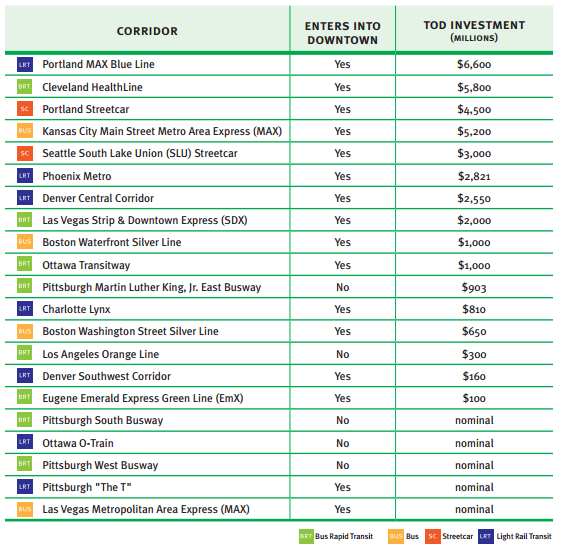
If a city’s downtown is so blighted that demand is unlikely to materialize in the near term, it is still generally worth serving the downtown with any BRT corridors that are planned to come near it, as it is almost always the case that downtowns revitalize more quickly than any other parts of a city. Additionally, a BRT that passes through the downtown can have positive development impacts along the rest of the corridor as well, since downtown access makes the entire corridor more attractive to developers. Cleveland, Ohio, USA’s Silver Standard HealthLine is a great example of a BRT that was built directly into the downtown and, as a result, leveraged over US$5.8 billion in development throughout the corridor.
Many cities have multiple subcenters that serve as smaller downtowns. It is often the case that serving these subcenters with Gold Standard BRT can have nearly the same effect as bringing BRT directly into the city’s main downtown.
Finally, the specific routing of BRT infrastructure through a city’s downtown or an important subcenter, particularly if there are currently no bus routes to mimic, may be subject to a political negotiation, since downtown streets are often quite narrow. However, the BRT should ideally be routed through the densest part of downtown.