5.3Corridor Prioritization Based on Existing Demand
Many roads lead to the path, but basically there are only two: reason and practice.Bodhidharma, Buddhist monk, 6th century
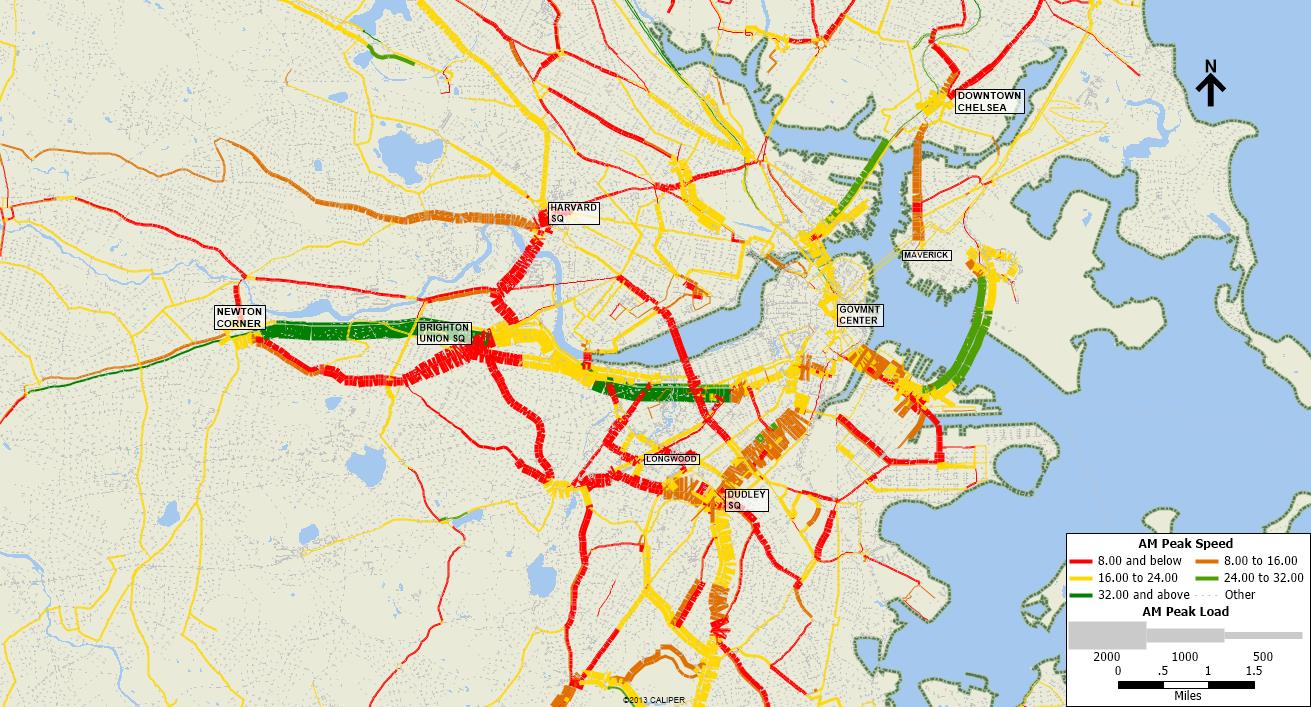
Once both existing ridership and existing speed data have been mapped, the two datasets can be overlaid so that there is one map showing where high demand and low speeds overlap. This is a good indication of where BRT is likely to have the most impact.
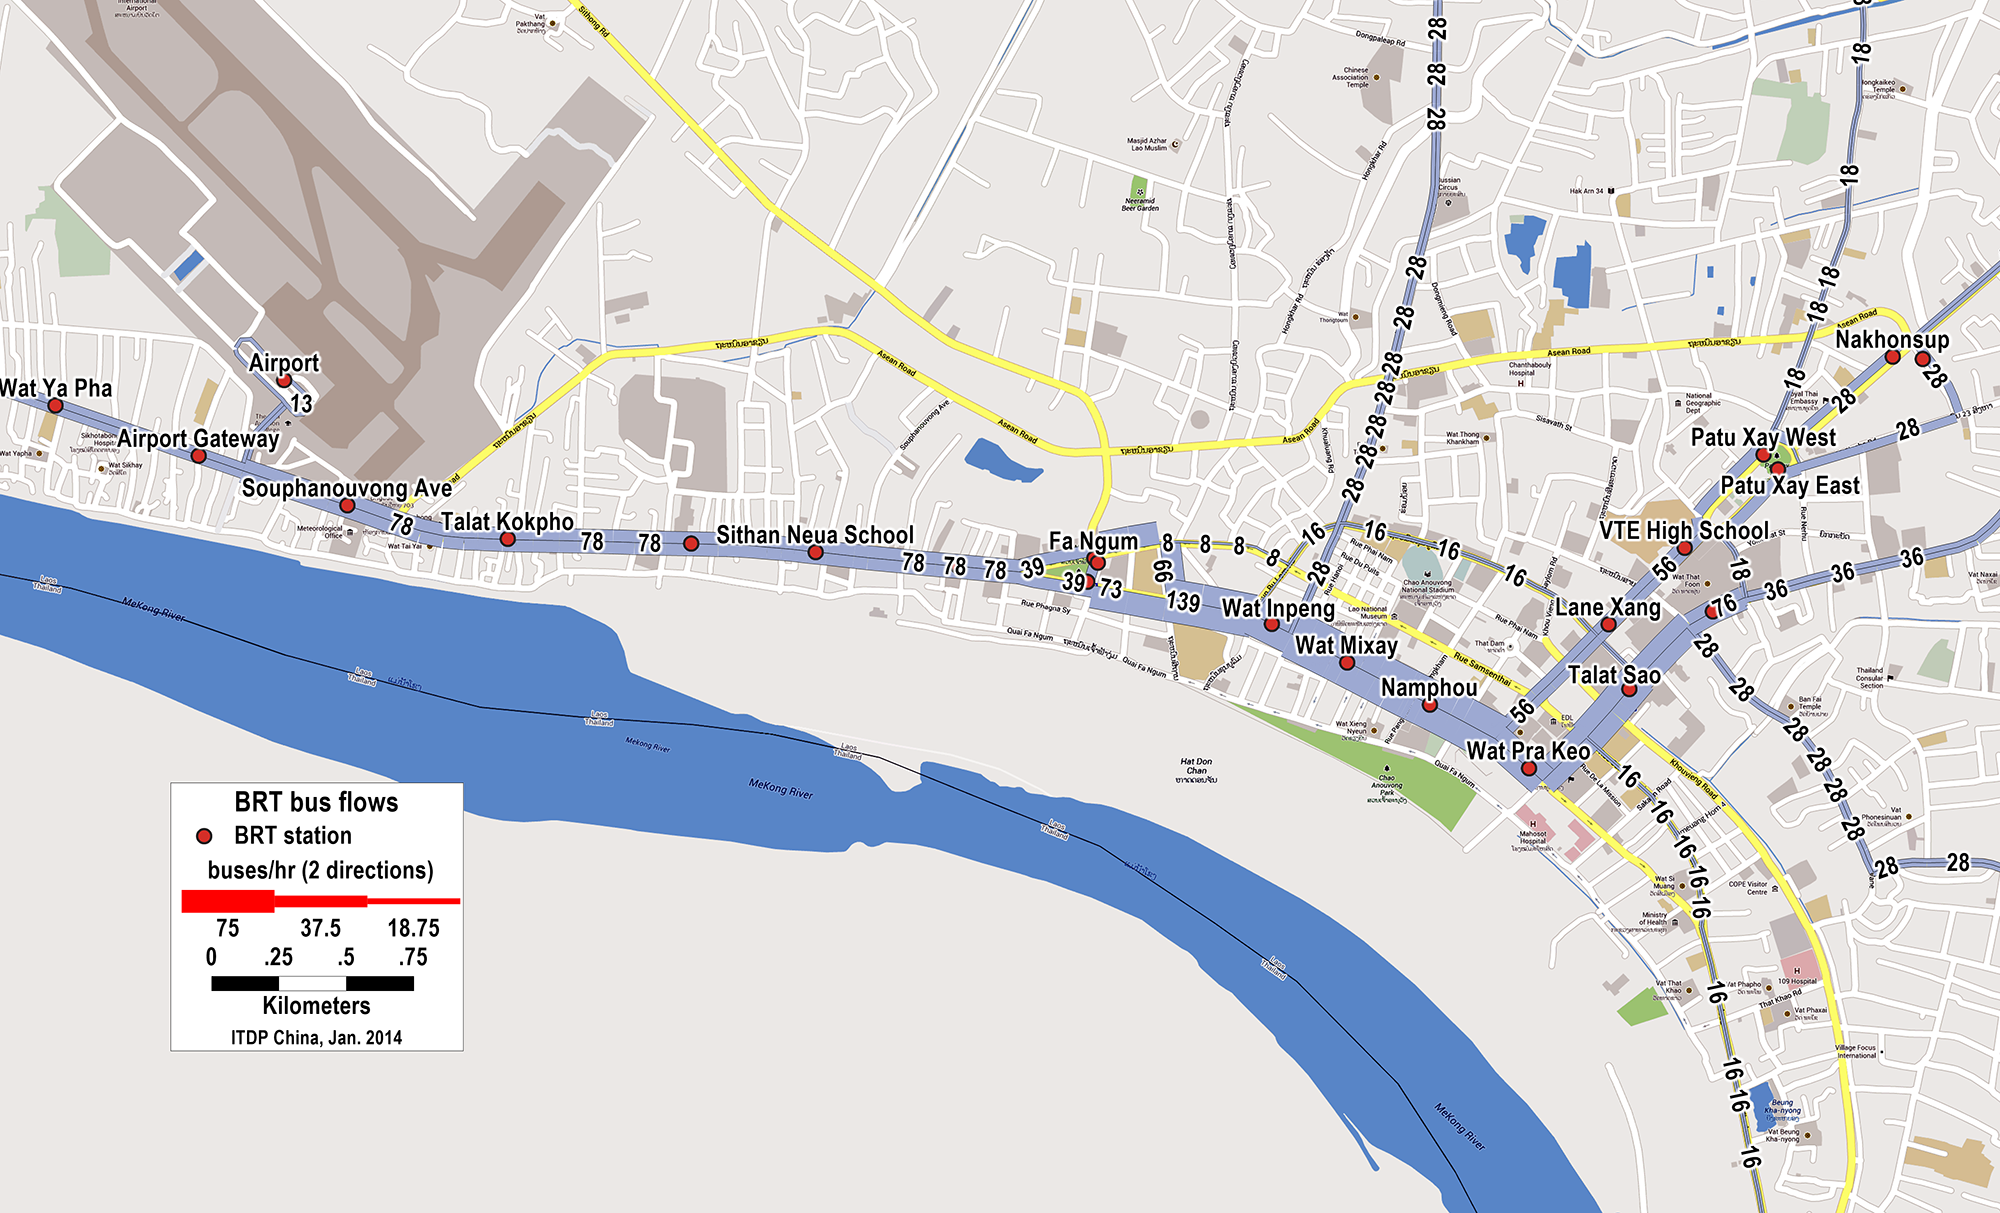
From here, potential corridors should be delineated. Per the definition of a BRT corridor, a corridor must be at least 3 kilometers in length. It is rare that one single corridor will have uniform ridership and speeds along its full length. Therefore, corridors must be selected by choosing 3 kilometer or longer continuous segments of roadway with relatively consistent demand and speed values. This requires some judgment on the part of the planner, and ideally some knowledge of the city. It may make sense to draw corridors along existing bus routes, but it is not necessary since bus routes may enter and exit corridors, so BRT infrastructure might also be built along segments of routes.
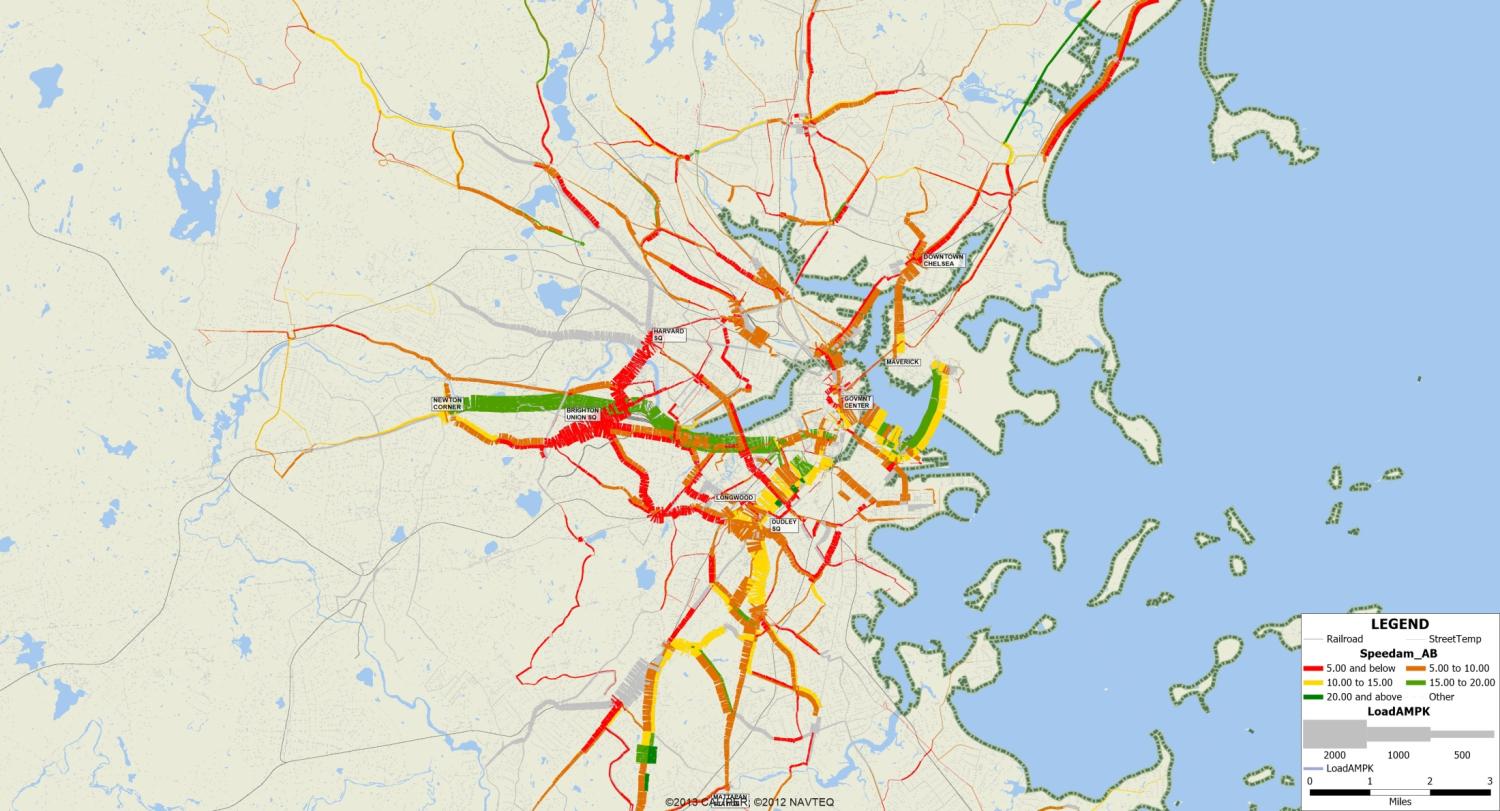
Once corridors have been identified, they should be ranked from highest demand to lowest demand, with a minimum threshold that planners believe can still reasonably bring the corridor up to 1,000–1,200 pphpd in the first year of operation. Each corridor should be color-coded based on its average speed. Those corridors with unusually high speeds for the region should be screened out, as they are likely already functioning at a relatively high efficiency. Additionally, those corridors on which another public transport project is currently being planned should also be screened out.
Table 5.1Rank order of Boston corridors from map in Figure 5.13. █ represents the least delay, ██ moderate delay, and ███ the most delay. The City Center to Government Center route currently does not exist, and thus the pphpd is not provided. Analysis done by ITDP.
| Rank | Corridor | pphd | Delay |
|---|---|---|---|
| 1a | Upgrade of existing Washington Silver Line | 1,615 | █ |
| 1b | Extension Dudley Square to Mattapan | 976 | ██ |
| 1c | Extension City Center to Government Center | - | ███ |
| 2 | Allston Union Square to Dudley Square | 1,273 | ███ |
| 3 | Downtown Chelsea to Government Center | 1,215 | ██ |
| 4 | Forest Hills to West Roxbury | 1,077 | ███ |
| 5 | Harvard Square South to Newton Corner | 998 | ███ |
| 6 | Forest Hills to Wolcott Square | 799 | █ |
| 7 | Allston Union Square to Longwood | 741 | ███ |
| 8 | Harvard Square to Watertown | 413 | ██ |
In many parts of the world, demand far surpasses these minimums. In such cases, it is generally reasonable to select the top ten corridors based on demand, as these are the corridors on which BRT is likely to have the most impact. In fact, The BRT Standard (2014) awards maximum points for corridors that are located in the city’s ten corridors with the highest demand.
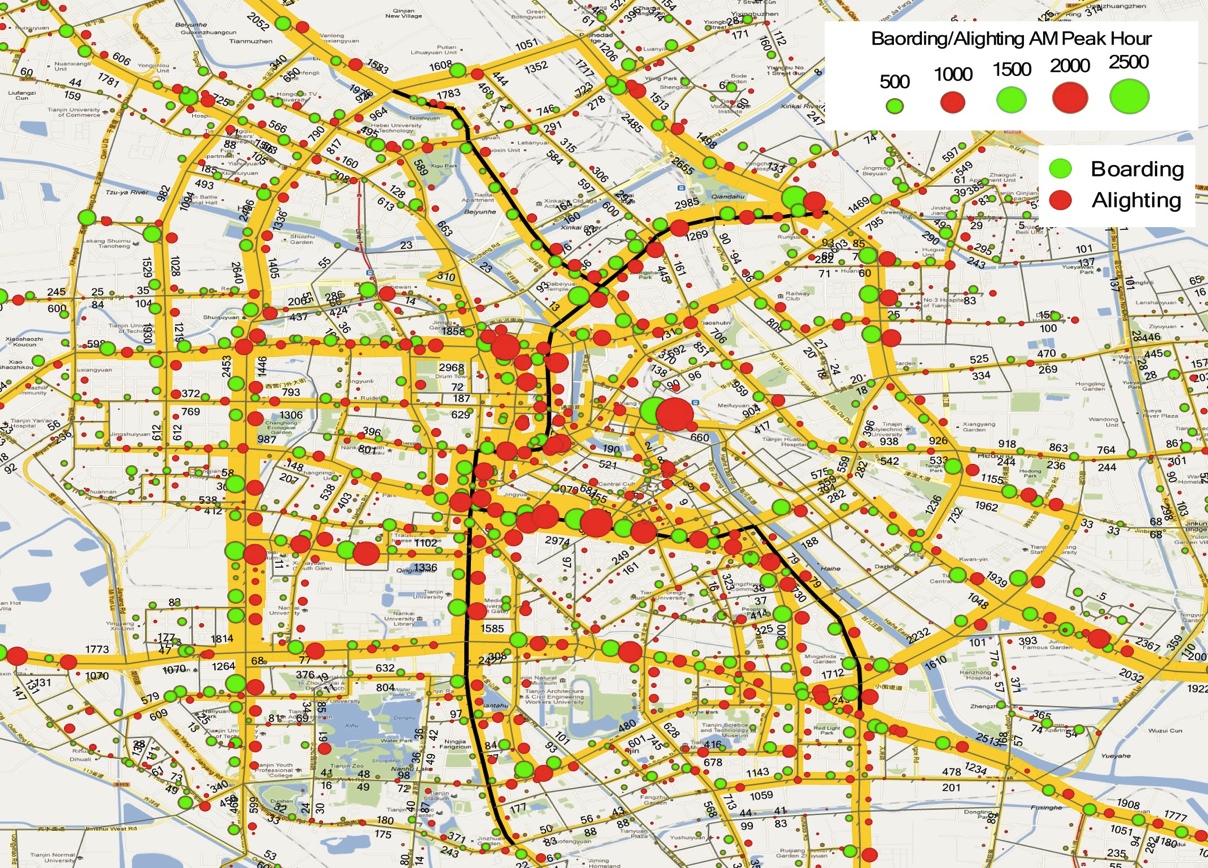
If stop-by-stop boarding and alighting data is available, it is also a good idea to map boarding and alighting volumes along the corridors. The larger the concentration of boardings and alightings along a corridor, the greater the likelihood that a BRT will be beneficial. Boarding and alighting can be used as a third metric for determining which corridors BRT could provide the most benefits.
With the top corridors ranked based on existing ridership and speed, we can assume that if any of them are upgraded to BRT, the ridership will increase due to the higher speed and attractiveness of the BRT as compared to the current bus routes or other options. In the first year of operation, it is reasonable to expect an increase of 30 percent above existing ridership. Unless ample resources are available to build a model, looking at existing conditions only is generally a reasonable means of determining which corridors are best suited for BRT and what kinds of ridership to expect in the opening year.
If a good set of corridors already exists based on this methodology, it is generally enough to build a BRT network plan. But sometimes, for political reasons, other corridors without existing bus routes, or with existing bus routes but with low demand, are desirable for BRT. In these cases, a costlier and more resource-intensive study must be undertaken in order to estimate demand on such a corridor and to insert it into the rank order with the other corridors already prioritized.