5.7Other Considerations in Corridor Selection
Success is a journey, not a destination.Ben Sweetland, author
The above framework and analysis should be sufficient to determine both the corridors that should be developed for the whole BRT system and the corridor that will be chosen for the pilot phase. While this is often all that is needed to make a decision about the right corridor, below are other considerations that can be used to choose the corridor, including:
- Customer time savings;
- Impact on mixed-traffic lanes;
- Implementation costs;
- Detailed cost-benefit analysis;
- Political considerations, including social goals.
5.7.1Customer Time Savings Benefits
As discussed above, main public transport service improvements result from reducing congestion and boarding and alighting delays, in addition to upgrading the overall transit experience. The worse the congestion and the larger the number of existing bus customers along the corridor, the more positive the impact of a BRT system. The economic impacts from these effects are typically calculated through time savings analysis. The analysis mentioned above should be sufficient to know where the most savings from delays will occur, but quantifying the economic impact may confirm the decision.
To calculate the time savings benefits to public transport customers, estimations on passenger numbers and vehicle speeds both before and after the new system are required. The average vehicle speeds will directly relate to the amount of travel time for a particular journey. Equation 5.1 provides a framework for calculating the customer time savings.
Eq. 5.1 Customer time savings
Where:
P = Number of passengers;
Tp = Present travel time;
Tf = Future travel time.
Because benefits will vary quite a lot not only between corridors but within corridors, it is necessary to add up the benefits for each link in the corridor. These benefits will also likely vary according to the time of day and the day of the week. A calculation of this type is most readily accomplished with the assistance of a traffic model. However, a simple spreadsheet analysis with inputted survey data can also suffice. The more complete time savings formula is given in Equation 5.2.
Eq. 5.2 Detailed time savings calculation
Where:
i = Link;
h = Period (morning peak, off peak, night, etc.);
Pih = Passenger flow on the link (passengers/hour);
Hh = duration of period h in hours
Tpih = present travel time on link I period h
Tfih = future travel time on link I period h
Pih*ΔHh produces the total number of passengers on a particular link during a particular period. This value, multiplied by the estimated time savings yields per link, produces the total number of hours saved by public transport customers. This value can then be multiplied by a monetary value of time, or it can be left in the form of hours saved.
The existing public transport vehicle speeds and customer counts should have been collected during the demand analysis work noted in Chapter 4: Demand Analysis. Likewise, the boarding and alighting surveys during this phase should have produced values for both peak and nonpeak periods.
Future average vehicle speeds and customer demand will depend on the system’s design. Future customer volumes should be based on a combination of existing passenger volumes in conjunction with the size of any expected mode shifting.
5.7.2Time Savings Benefits for General Traffic
Corridor selection may also depend on the impact BRT infrastructure will have on mixed traffic flow. Ideally, BRT will improve mixed traffic speeds by taking the buses out of the traffic lanes and reducing delay from buses pulling over and stopping for customers. However, this might not always be the case. There are select instances where BRT could make mixed traffic flow much worse, which may become a political problem. The three most important indicators of the likely impacts of BRT on mixed traffic are: the current traffic mix; the available right-of-way relative to the existing road; and the possible behavioral and travel changes of motorists once the new public transport system is in place.
Current Traffic Mix
Normally, for a BRT system to be considered an option, there is likely to be significant congestion on at least part of the corridor. As a general rule, the greater the current contribution of public transport vehicles to the current congestion problem, the greater will be the chance that a new BRT system will actually decongest the mixed traffic-lanes (Figures 5.25 and 5.26).
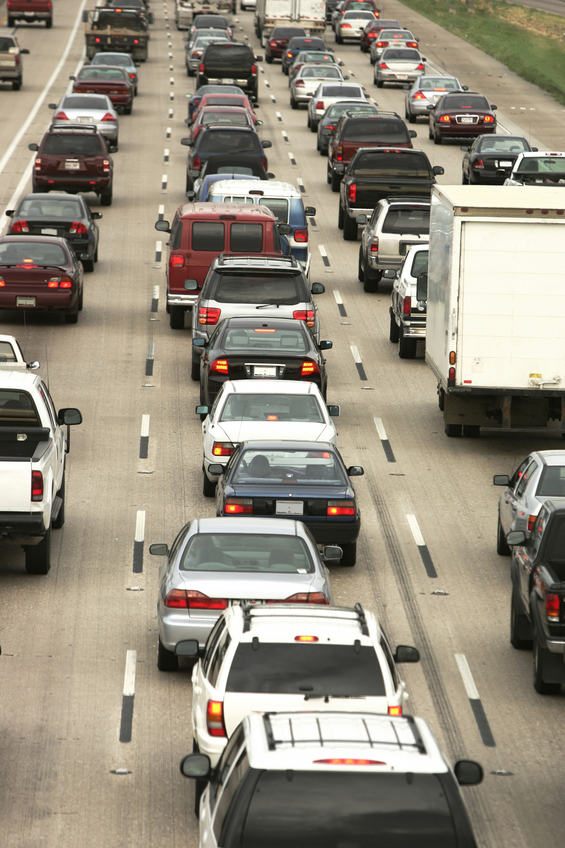
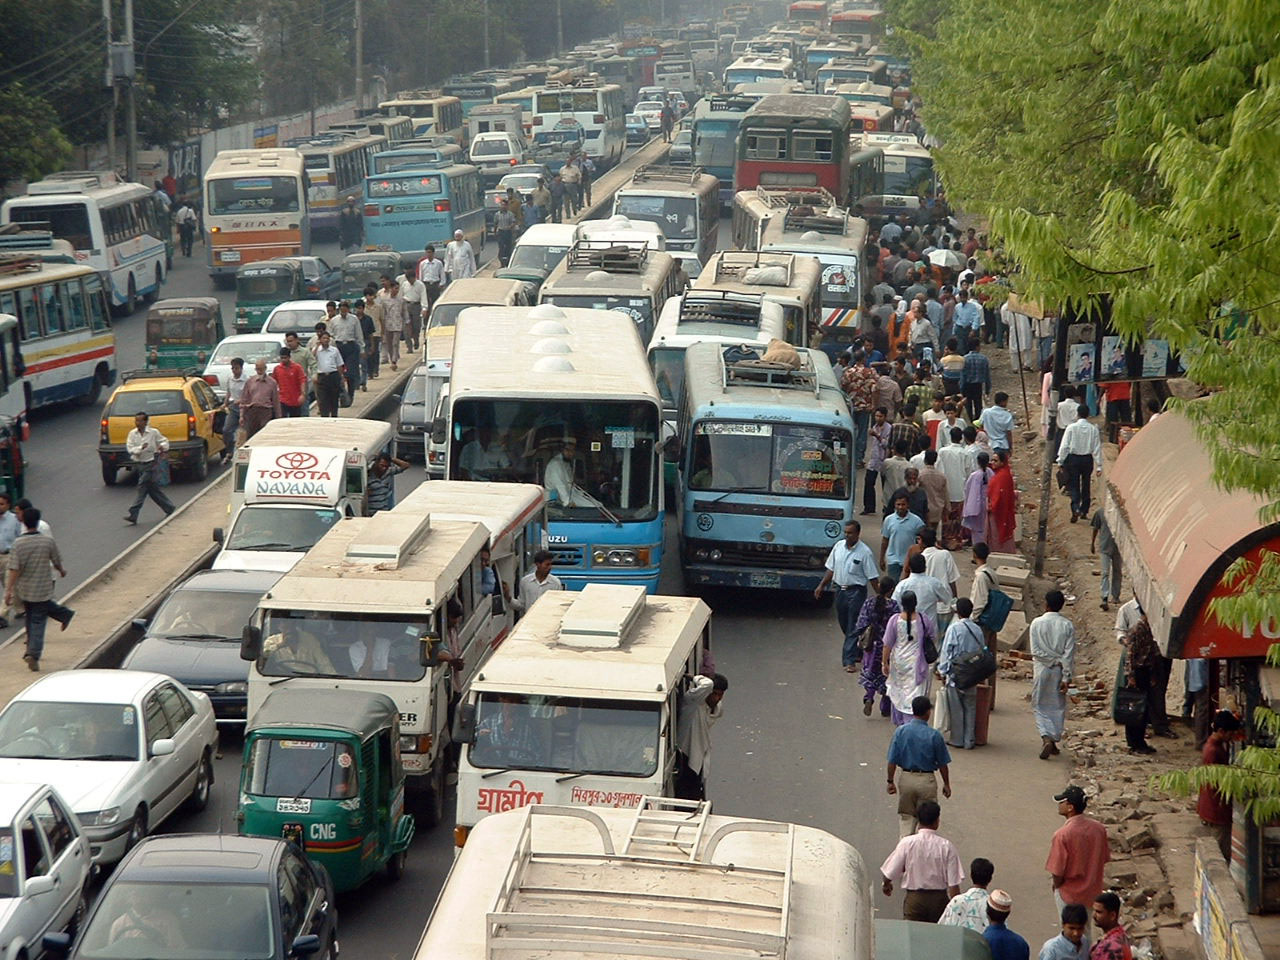
In countries with higher bus volumes, public transport vehicles frequently have a disproportionately higher impact on congestion relative to private vehicles. This impact occurs because the vehicles often stop and go at undesignated bus stops, and because the vehicles sometimes stop two and even three abreast to pick up customers. Bringing these public transport operators into a new BRT system, therefore, frequently offers the opportunity to decongest mixed traffic-lanes even if a full lane or two become exclusive to buses. In such cases, the new BRT system can easily produce a somewhat counterintuitive result; taking away road space and giving a priority lane to public transport can actually give motorists more space and produce less overall congestion.
The specific congestion impact of the BRT system will depend on which public transport vehicles are incorporated into the new BRT system and which are excluded. The more public transport trips that can be incorporated into the BRT system, the less adverse impact the remaining public transport trips will have on the mixed-traffic lanes.
Methodology for Estimating Impacts on Mixed Traffic
As a rough estimate, one can calculate the likely impact of a planned exclusive busway on mixed traffic in the following manner: The existing traffic flow at the most congested point of the road (based on traffic counts) should be converted to passenger car units (PCUs) for each available road lane. If the road lanes are not delineated, then this PCU conversion should be done for every three meters of road width.
Normally, lanes with a width of 3 to 3.5 meters can handle approximately 2,000 PCUs per hour. The more the PCUs over 2,000 per lane, the more congested the road will become.
This level of existing congestion should then be compared to the scenario with the BRT system in place. Some of the current public transport vehicles will be relocated onto the new BRT system, and others will remain in the mixed-traffic lanes. All the vehicles that will not be incorporated into the BRT system, including the buses not incorporated into the system then need to be converted into PCUs, and allocated to the remaining number of lanes (or three-meter road widths). Table 5.2 provides an example of this type of analysis.
Table 5.3PCU calculation for BRT scenario
| Vehicle type | Traffic volume | Average passengers per vehicle | Total passengers | PCU equivalent | PCU total |
|---|---|---|---|---|---|
| Cars | 1,200 | 2.5 | 3,000 | 1 | 1,200 |
| Taxis | 500 | 1.2 | 600 | 1 | 500 |
| Motorcycles | 170 | 48 | 8,160 | 2 | 340 |
| Remaining buses | 300 | 1.5 | 450 | 0.25 | 75 |
| Total | 2,170 | - | 12,210 | - | 2,115 |
If the PCUs of the BRT scenario are higher than the PCUs of the pre-BRT scenario, then the new BRT system will tend to increase congestion of the mixed-traffic lanes. If it is lower, it will lead to lower congestion levels. Because the PCUs of buses are generally double that of private cars and taxis, and eight times as high as motorcycles, the more buses in the existing traffic stream that are relocated to the new BRT system, the greater the degree to which the remaining mixed-traffic lanes are decongested. A more detailed and accurate calculation of traffic congestion impacts can be obtained through a traffic software model.
Once the level of traffic is estimated for both the baseline case and the BRT case, then the amount of time savings for occupants of mixed-traffic lanes can be calculated. Box 5.1 provides an overview of the time savings calculation.
In practical terms, the changes to intersections along a BRT corridor far exceed the importance of lane allocations to general traffic between intersections, and can result in dramatic improvements for both BRT buses and mixed traffic despite any lane reductions due to BRT lane segregation and the extra space required at BRT stations.
Box 5.1 Calculating Time Savings for Vehicle Occupants in General Traffic
On some critical sections (i), present general traffic volume on peak periods (j) will exceed the road’s capacity, by a certain amount: ΔSij. The total general traffic prejudice on that point “i” is then estimated by Equation 5.3.
Equation 5.3 Time savings for general traffic
Where: i = Point of evaluation where one of the following effects takes place:
- 1. The point is the bottleneck of the corridor
- 2. The point is not the bottleneck, but future capacity (after BRT) will fall below present peak volume
j = A specific peak hour. There are normally two peak periods, a morning peak and an evening peak. A velocity survey for cars will more accurately identify the peak periods.
TGCj = Total time savings for general traffic
ΔSj = the amount of change on capacity to the new scheme. This value will be negative value if there is a reduction in capacity; this value will be positive if there is an increase in capacity.
Tcongji = duration of the congestion period being considered. The peak period can be better estimated by traffic velocity surveys that show when travel times increase more drastically. Usual values are around 0.5 to 3 hours.
Ki = reflects a group of factors derived form network analysis and demand elasticity.
It should be noted that reductions of capacity on two successive nearby points are not independent, and the more congested point should usually be considered the important one.
5.7.3Implementation Costs
In general, the more complicated the physical aspects of a corridor, the more costly the planning and construction will be. Any of the following infrastructure components along a proposed corridor can cause costs to escalate:
- Road widening;
- Use of median;
- Relocation of utilities;
- Underpass or tunnel;
- Flyover, overpass, or elevated segment;
- Bridges;
- Large roundabouts.
Road widening can be particularly costly, especially when any property acquisition is considered. These considerations may affect the decision of which corridor to implement when.
As Quito has demonstrated, in some cases, underpasses and complicated roundabouts can be handled without extravagant costs. By contrast, simply converting a mixed-traffic lane to a BRT runway without any of these complications can reduce both planning and infrastructure costs.
Several Chinese cities are contemplating placing BRT runways along ring roads. Much of the reasoning is related to the existing right-of-way space and the relative ease of construction. However, customer access to a ring road station (both in terms of horizontal and vertical distances travelled) can be difficult. Building these “easy” infrastructure projects may eventually undermine the BRT concept. A BRT system with few customers may seem to operate quite smoothly, but it will not be cost effective and is unlikely to move public opinion to support future expansion.
5.7.4Calculating the Cost-Benefit Ratio
A cost-benefit analysis incorporating the benefits from time savings, fuel savings, and environmental improvements can do much to help shape the eventual decision. Quantifying these benefits will also improve the project’s attractiveness to many financial institutions.
A cost-benefit analysis calculates the ratio of a project’s benefits to its costs. The larger this ratio, the more attractive a project is likely to be to decision makers and financing organizations. Equation 5.4 provides the framework for calculating the cost-benefit ratio.
Equation 5.4 Cost-benefit ratio
Where:
BC = Total benefit-cost ratio
Btp = Time savings for public transport customers
Btm = Time savings for occupants of mixed-traffic vehicles
Bfp = Fuel savings to public transport vehicles
Bfm = Fuel savings to mixed-traffic vehicles
Be = Environmental benefits
Ci= Implementation cost.
Box 5.2 provides an example of a multi-criteria analysis using two of the factors presented in this section.
Box 5.2 Calculating the Benefit to Cost Ratio
As a simplified example of this calculation, the table below presents a hypothetical example of time savings benefits for BRT vehicles and mixed-traffic vehicles. The “weighting” factor indicates how much consideration is given to each stakeholder group (transit users and car users). In this first case, each group is given an equal weighting.
Table 5.4Time savings benefits, Scenario 1
| Corridor | Time savings benefits | Cost | Benefits to cost ratio | ||
|---|---|---|---|---|---|
| BRT | Cars | Total | |||
| Weighting | 1 | 1 | |||
| A | 50 | -6 | 44 | 10 | 4.4 |
| B | 2 | 0 | 2 | 5 | 0.4 |
In the above scenario, corridor A attracts a high volume of ridership. The benefits awarded to transit users in this case will greatly exceed the costs to car users. Corridor B is a low-ridership area but with little congestion, and therefore no time impact on car users. In this case, the time benefit to public transport customers is quite small. From these two options, the benefit to cost ratio for corridor A is eleven times greater than the same ratio for corridor B. Thus, from a time savings perspective, corridor A would be the chosen corridor.
If political officials were concerned about reactions from car owners, then the weighting for this group might be increased to five. But as the table below indicates, even this amount of prioritization to car interests would not change the overall result.
Table 5.5Time savings benefits, Scenario 2
| Corridor | Time savings benefits | Cost | Benefits to cost ratio | ||
|---|---|---|---|---|---|
| BRT | Cars | Total | |||
| Weighting | 1 | 5 | |||
| A | 50 | -6 | 20 | 10 | 2 |
| B | 2 | 0 | 2 | 5 | 0.4 |
However, if officials were particularly worried about car owner reactions, and therefore gave a priority weighting of ten to private vehicles, then the result would change.
Table 5.6Time savings benefits, Scenario 3
| Corridor | Time savings benefits | Cost | Benefits to cost ratio | ||
|---|---|---|---|---|---|
| BRT | Cars | Total | |||
| Weighting | 1 | 10 | |||
| A | 50 | -6 | -10 | 10 | -1 |
| B | 2 | 0 | 2 | 5 | 0.4 |
In this scenario, corridor A would be a less desirable choice than corridor B. However, with the low benefit ratio for public transport customers, corridor B would risk doing little to promote the future prospects of BRT development in the city.
An expanded benefits table could be constructed to also factor in impacts from fuel savings and environmental improvements.
5.7.5Political Considerations
Capricious decision-making not grounded in analysis of actual travel demand can result in costly mistakes that do little to support a quality service for the customer (e.g., Lima’s Tren Eléctrico). At the same time, political considerations can be quite appropriate in augmenting technical data. In fact, democratically elected officials have a responsibility to utilize their judgments in making determinations between different sets of costs and benefits. Some of the key instances requiring political inputs include:
- Preference to place initial corridors in a high-visibility location in order to promote the BRT concept more widely;
- Preference to locate corridors initially in low-income communities in order to promote greater social equity;
- Avoidance of corridors that may conflict with other infrastructure plans or with other governmental entities;
- Avoidance of corridors requiring extensive reorganization of many existing formal and informal public transport operators.
A purely technical analysis of the corridor attributes can miss some of the more subtle political considerations that may greatly affect the project’s viability.
Frequently, the most difficult problem is that the corridors with the highest existing public transport volumes have already been included in a master plan for a future metro project. Decision makers are reluctant to plan a BRT on a future metro corridor for fear of eliminating the possibility of national government funds for a metro. In such cases, it may be politically expedient to propose putting BRT in the corridor as a temporary measure that can be upgraded at a later date. While this rationale was utilized successfully with TransJakarta Corridor I, it is currently being dismantled, as construction of the metro has commenced. This reinforces the notion that BRT is a second-class option for rail and undermines the legitimacy of BRT as a high-quality public transport system, and should be undertaken with care.
Political inputs can be particularly appropriate when cultural or social issues are at stake. In Hyderabad, India, the presence of a Muslim graveyard on both sides of the road creates a bottleneck on the main highway bisecting the city from the northwest to the southeast. An engineering solution may call for expropriating parts of the graveyard for road widening. But for a Hindu-dominated government to relocate this graveyard would likely be both politically and socially unsound. Thus, reasoned political judgment may be needed to curtail any discussion of road widening.
It may also be advisable in Phase I not to disrupt too many existing public transport routes that are not going to be incorporated into the new system. Negotiations with existing public transport operators are a delicate part of BRT planning, and it is generally advisable not to take on the entire private-sector transit industry at once. Corridors with a large number of existing separate bus operators will make the negotiations for reforming the system a lot more complex than corridors where there are only a small number of operators. This consideration was a determining factor with the Silver Standard Insurgentes BRT Corridor in Mexico City, and is also a factor in the planning of the Dar es Salaam system.
Social considerations may be a leading determinant in corridor decision-making. Public transport systems perform many key social functions in a city and have often played a central role in regeneration efforts. Political leaders and project developers may thus seek to target areas that would most benefit from a public transport investment.
Focusing the initial phase in a low-income community can produce several economic and social-equity benefits. The new public transport system will connect these residents to jobs and public services in the city’s central areas. The system itself will also likely produce both direct and indirect employment opportunities for the community. Recent studies from Bogotá indicate that the significant reductions in travel costs resulting from TransMilenio have greatly expanded the potential job market for lower-income residents, increasing employment and wages among lower income groups.
A new public transport system can also do much to attract investment to lower-income areas. Additionally, the presence of the system can instill a sense of pride and community in areas that previously felt abandoned and ignored. For these reasons, Bogotá purposefully located its initial BRT corridor in between the central area and the lower-income south side of the city.
In both Guangzhou and Lanzhou, China, BRT systems appeared to lead to significant increases in civic pride in lower-income areas served by the BRT corridor. In Guangzhou those agreeing that, “I am proud of Guangzhou” increased among customers in the BRT corridor from 40 percent before the BRT to 73 percent after the BRT. Among car drivers, the figure was unchanged, and in the control survey in a different corridor, civic pride among bus passengers declined over the same period. The Lanzhou BRT, which opened in January 2013, also spurred large increases in civic pride, with those agreeing “I am proud of Lanzhou” increasing among customers in the BRT corridor from 40 percent before the BRT to 70 percent after the BRT. Pedestrians, cyclists, and motorists saw a similar increase of more than 30 percent, while in the control corridor there was no significant change.
Access to BRT can also increase land values, which can be a double-edged sword. Recent studies indicate that TransMilenio led to significant increases in property values in areas served by a TransMilenio feeder bus. For low-income families without land tenure, the benefits of lower transportation costs may be lost to higher rents. It is therefore a good idea to prioritize efforts to give low-income families land tenure in planned BRT corridors so that the resulting property value increases can be captured by the families instead of by land speculators.
At the same time, there are also social and environmental reasons for including middle- and upper-income communities in a project’s early phases. While Bogotá did target the lower-income areas south of the city, Mayor Enrique Peñalosa also intentionally included a corridor extension into the more affluent north of the city. The wealthier areas of a city are obviously the locations of higher vehicle ownership. Thus, from the standpoint of shifting car users to public transport, there is greater emissions and congestion reduction potential in targeting car-owning households. Further, the mayor also saw significant social benefits from encouraging greater interactions between economic classes. Peñalosa has noted that: “A public transport system may be the only place that the rich and the poor interact with one another.” In terms of propagating understanding and awareness among social groups, a high-quality public transport system can thus be a potential social unifier within a city. Having the new system also serve higher-income groups also helps encourage political buy-in to the system by influential families. Finally, in places like Cape Town, South Africa, running the Bronze Standard MyCiTi BRT into middle-income neighborhoods demonstrated that public transport is not just for the poor and garnered more support from rich and poor alike in the rollout of future phases.
Social-equity issues may also be central to loan prerequisites from major international financing organizations. Most development institutions, such as the Asian Development Bank, justify investments in terms of poverty alleviation. Thus, ensuring that a reasonable number of BRT customers are below median income is important to link the system to broader goals of poverty alleviation.