5.2Transit System Speed and Delay Analysis
You think that because you understand ONE you understand TWO, because one and one makes two. But you must understand AND.Sufi proverb
BRT infrastructure is only going to yield significant benefits if buses on the corridor are currently operating below their optimal speed. Therefore, the slower the existing bus or minibus speeds on an existing corridor, the greater the theoretical potential for BRT investments to improve the situation. For this reason, after looking at existing transit demand, it is a good idea to evaluate existing transit speeds, and to map these speeds in such a way that they are very clear.
Average bus speeds can be calculated either from transit agency data, or by frequently riding the bus routes in corridors being investigated and measuring bus speeds with a GPS. Below is a simple map of average peak hour bus speeds developed during an alternatives analysis for the proposed Tianjin BRT.
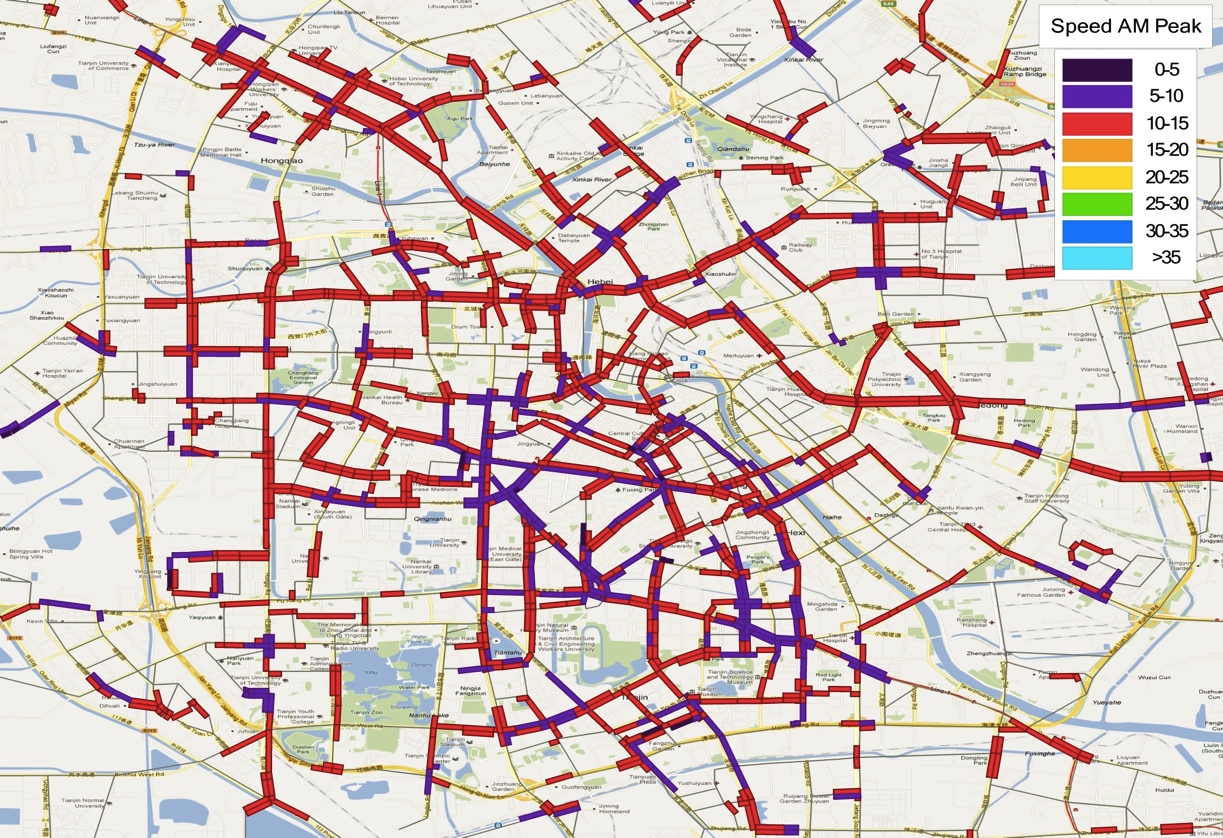
If average bus speeds in a corridor are relatively high, BRT infrastructure is less likely to bring a significant improvement in bus speeds. If, on the other hand, speeds are very low, then BRT investments are more likely to bring about significant passenger time savings and operational benefits.
Gold Standard
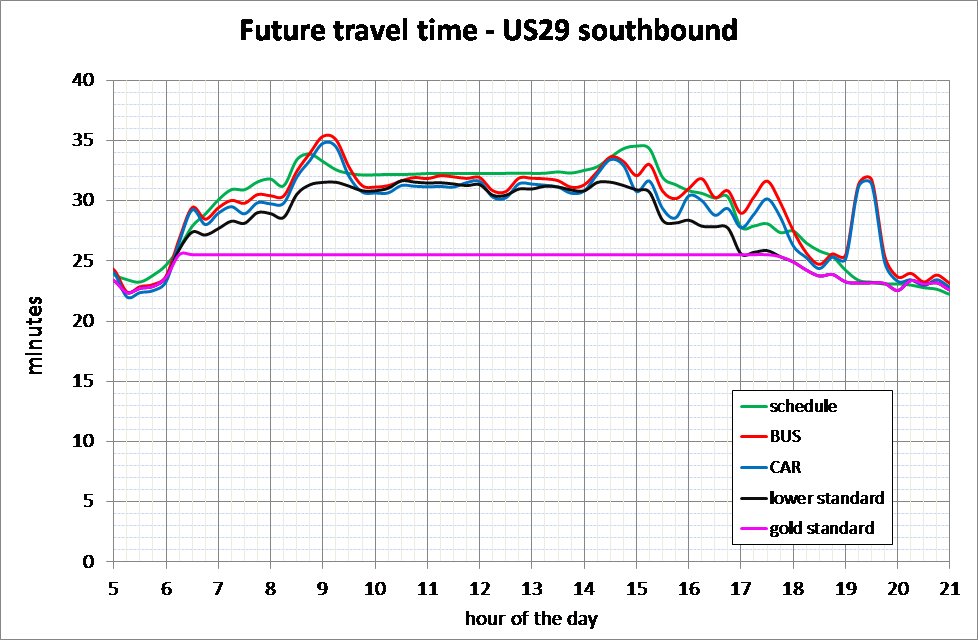
Figure 5.9 is a graphic taken from an analysis of two parallel corridors in Chicago. It compares the existing running time on two proposed BRT corridors to what could be achieved on the corridor were “Gold Standard” BRT investments made.
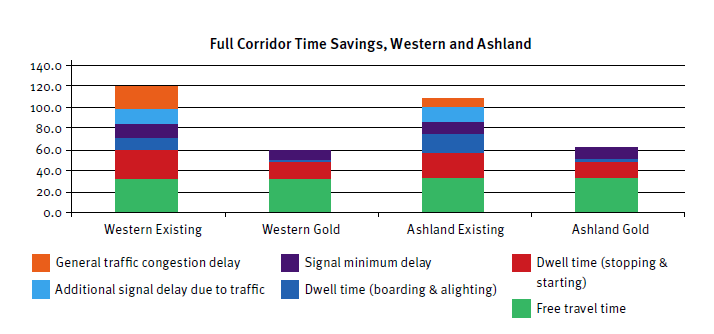
Gold Standard BRT systems are primarily designed to reduce delay caused by boarding and alighting and general traffic congestion. If the cause of delay is congestion, dedicated lanes without other BRT infrastructure may be sufficient. If the primary cause of delay is from boarding and alighting, off-board fare collection and at-level boarding, without exclusive lanes, may be sufficient. Full BRT is most valuable where both types of delay are present.
Without knowing anything else about the BRT system design, it is generally safe to assume that Gold Standard BRT systems operating on urban arterials are likely to increase average speeds to as high as 29 kph, or in dense downtowns, as high as 20 kph. BRT speeds on highways could be significantly higher. More corridor-specific data about the existing causes of delay can yield far more refined estimates of the likely time savings benefits of BRT infrastructure.