4.3Basic Methods for Estimating Public Transport Demand
Computers are useless. They can only give you answers.Pablo Picasso, artist, 1881–1973
The proper data processing of an appropriate sample size, with a few inference models, shall be enough to describe the demand of the current public transport system in the influence area of the BRT system. Modified by assumptions, this is a reliable indicator of the potential demand for a BRT system.
4.3.1Estimating Demand by Aggregating Boarding and Alighting Data
The boarding and alighting surveys in section 4.2.4 will give a picture of how many customers are currently on each existing bus route, and how many customers are boarding and alighting at each existing bus stop.
This is done by simply adding up the boarding and alighting numbers from each of the bus routes at each stop, and calculating the onboard customers along each link. For cities that do not have defined bus stops, the BRT planner can divide the entire network into segments and total customer boarding and alighting at each segment.
This was part of the approach used by ITDP working with the Guangzhou Municipal Engineering Design and Research Institute to plan the operations and infrastructure in the Guangzhou BRT system.
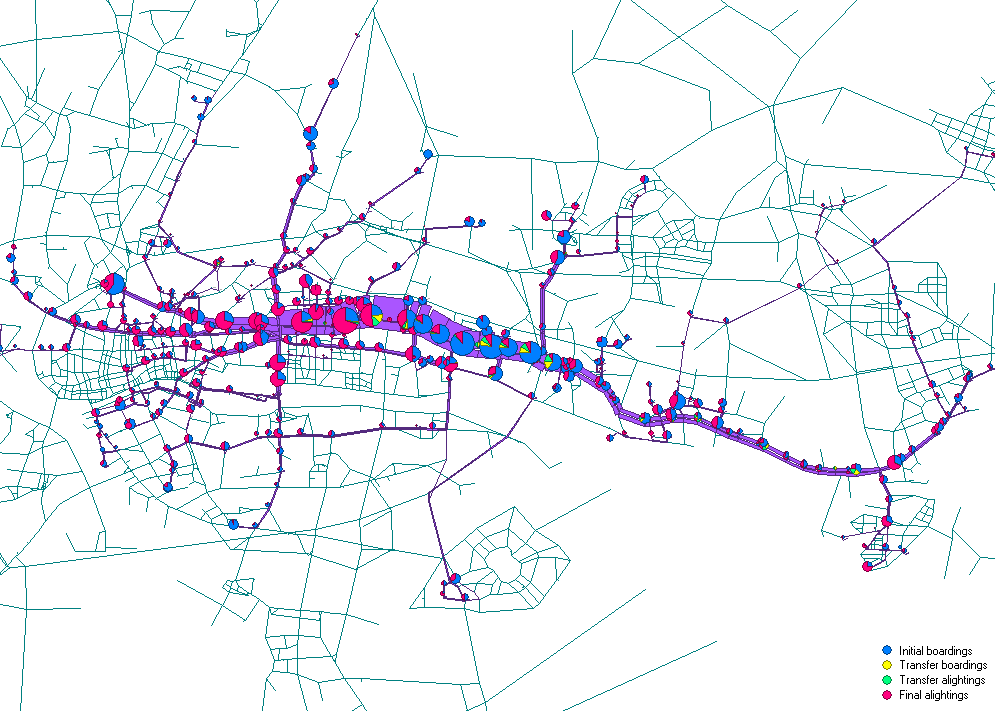
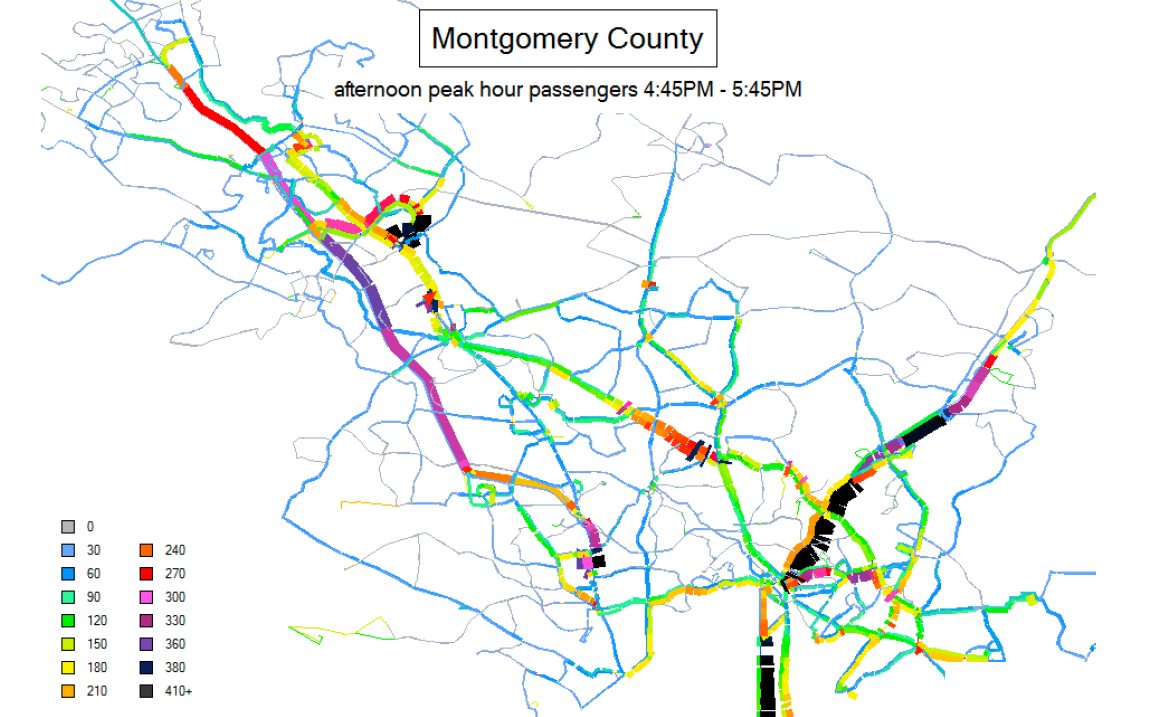
The same data can be used to calculate the total customers onboard BRT vehicles along each link of a BRT corridor, and from this the existing maximum customer load at the critical link can be identified (Figure 4.18).
In cities that have both APC data and GTFS data, it is also possible to attribute the APC boarding and alighting data to each route mapped on GTFS to create a very detailed link-by-link, hour-by-hour map, and table of existing public transport demand. This process is currently quite labor intensive, as most GTFS data is not that clean and APC data is not that easy to attribute to specific bus stops. However, it is still faster and cheaper than doing system-wide boarding and alighting surveys. As cities standardize data input processes, and protocols are established for this, it should become even faster and cheaper.
The demand on the future planned BRT system, however, will vary from the existing demand in a few key aspects. First, if not all the existing bus routes will be allowed to continue on the corridor and make use of the BRT infrastructure, then the demand will be only that subset of customers whose former bus routes have been either incorporated into the new BRT system’s service plan, or cut and replaced with a new BRT route. Second, if the speeds on the new BRT system are higher than the existing bus speeds, the new BRT system will gain customers from other bus routes and from other modes.
Ideally, a thorough and well-thought-out BRT service plan would then be developed, and the demand for this specific service plan would be tested. At the early stages of the planning process, though, most BRT system planners use simple rules of thumb to get a preliminary demand estimate.
Normally, each of the existing bus routes that operate along a corridor selected for BRT trunk infrastructure will be ranked based on two parameters:
- The percentage of the existing bus route that traverses the corridor;
- Frequency (and the occupancy, if possible) of bus routes in each direction.
To determine which routes should be included in the system and which routes should be left to operate outside the system, rerouted, or cut, a certain minimum cutoff for the above two parameters is generally used, as was done in Figure 4.19, which applies a policy minimum of four buses per hour and at least 20 percent of the total length inside the BRT corridor, before a route can be considered for inclusion in the BRT system.
Routes with a higher frequency and higher percentage in the BRT corridor are preferred for inclusion in the BRT system. A similar approach was used in selecting the BRT routes in Guangzhou and the Pune, India, region, as well as in Mexico, where the existing bus operator also became the BRT operator.
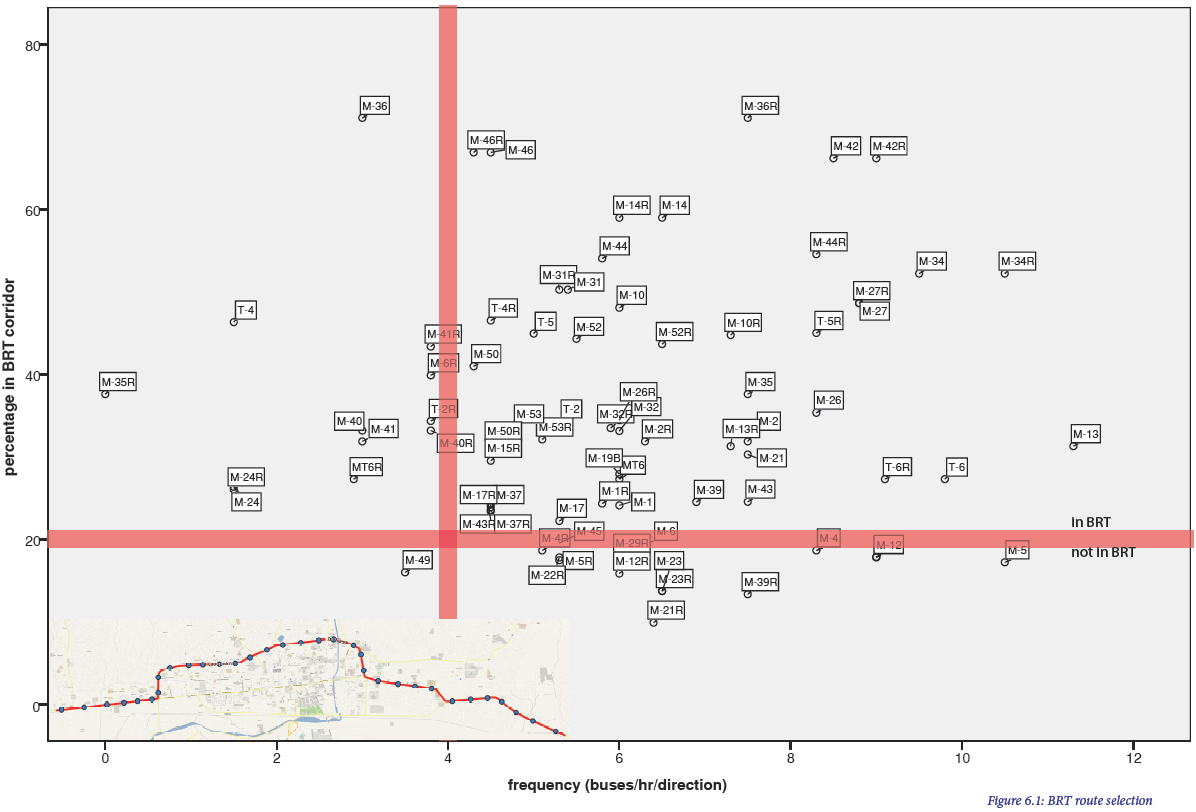
Figure 4.20 is an example from the early planning stages of the Ulaanbaatar BRT system, where, after applying a policy preference for at least four buses per hour and 20 percent of the route length inside the BRT system, the remaining routes could be included in the BRT system. These percentages are not hard and fast rules. The idea is simply to capture as much of the existing public transport demand as possible in the most efficient way for the BRT system. Given that station space is at a premium and that operation of the BRT requires new buses, routes with higher frequencies and percentages in the corridor are prioritized. This is a preliminary step. Detailed subsequent service planning is covered in Chapter 6.
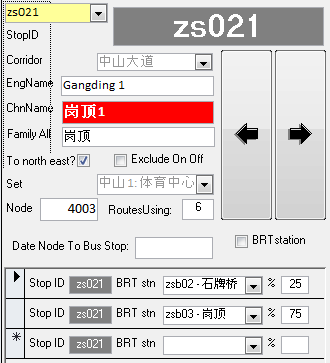
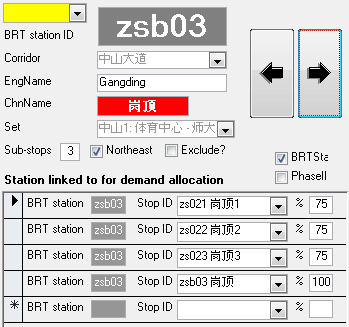
When building a BRT system, some bus stops are going to be eliminated and other stops are likely to be consolidated. Therefore, the current numbers of boarding and alighting customers from the bus routes that are to be included in the system need to be allocated to the new BRT stations. This is generally done by proximity: the existing boarding and alighting trips are allocated to the nearest new BRT station.
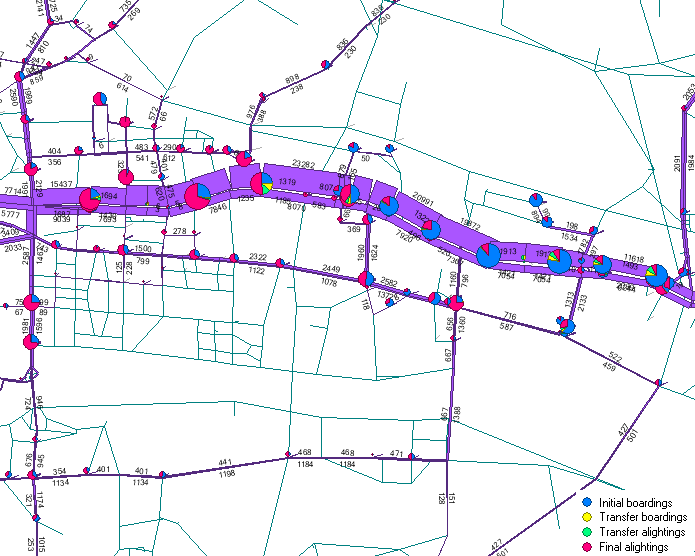
By collating the total number of boarding and alighting customers at each new BRT station stop from each of the existing routes that are likely to be incorporated into the new BRT system, the number of boarding and alighting customers per stop can be estimated. By collating the total numbers of customers on board for each link (taken from the same data set), the maximum load on the critical link of the new BRT system can be estimated. This maximum load will be a critical input into making design decisions for service and infrastructure planning as detailed in the following chapters.
The new BRT system, if designed correctly, should be able to achieve speeds of up to 29 kph on a major arterial if express routes are included, and 17 kph in downtown areas (with local service). Multiplying the number of projected customers by the difference between existing aggregate speeds and the projected BRT operating speed will yield the projected time-savings benefit of the corridor, but planners should keep in mind that it will not gain door-to-door travel time savings. The other main benefit that can be quantified is the fleet saving for BRT operators, taking into account the increase in bus speeds after BRT is implemented, and using bus fleet requirements as a proxy for overall operational costs. These two factors are what convinced the Guangzhou City Government to implement BRT in a heavily congested city center corridor, rather than in a peripheral suburban location.
4.3.2Mode Shifts
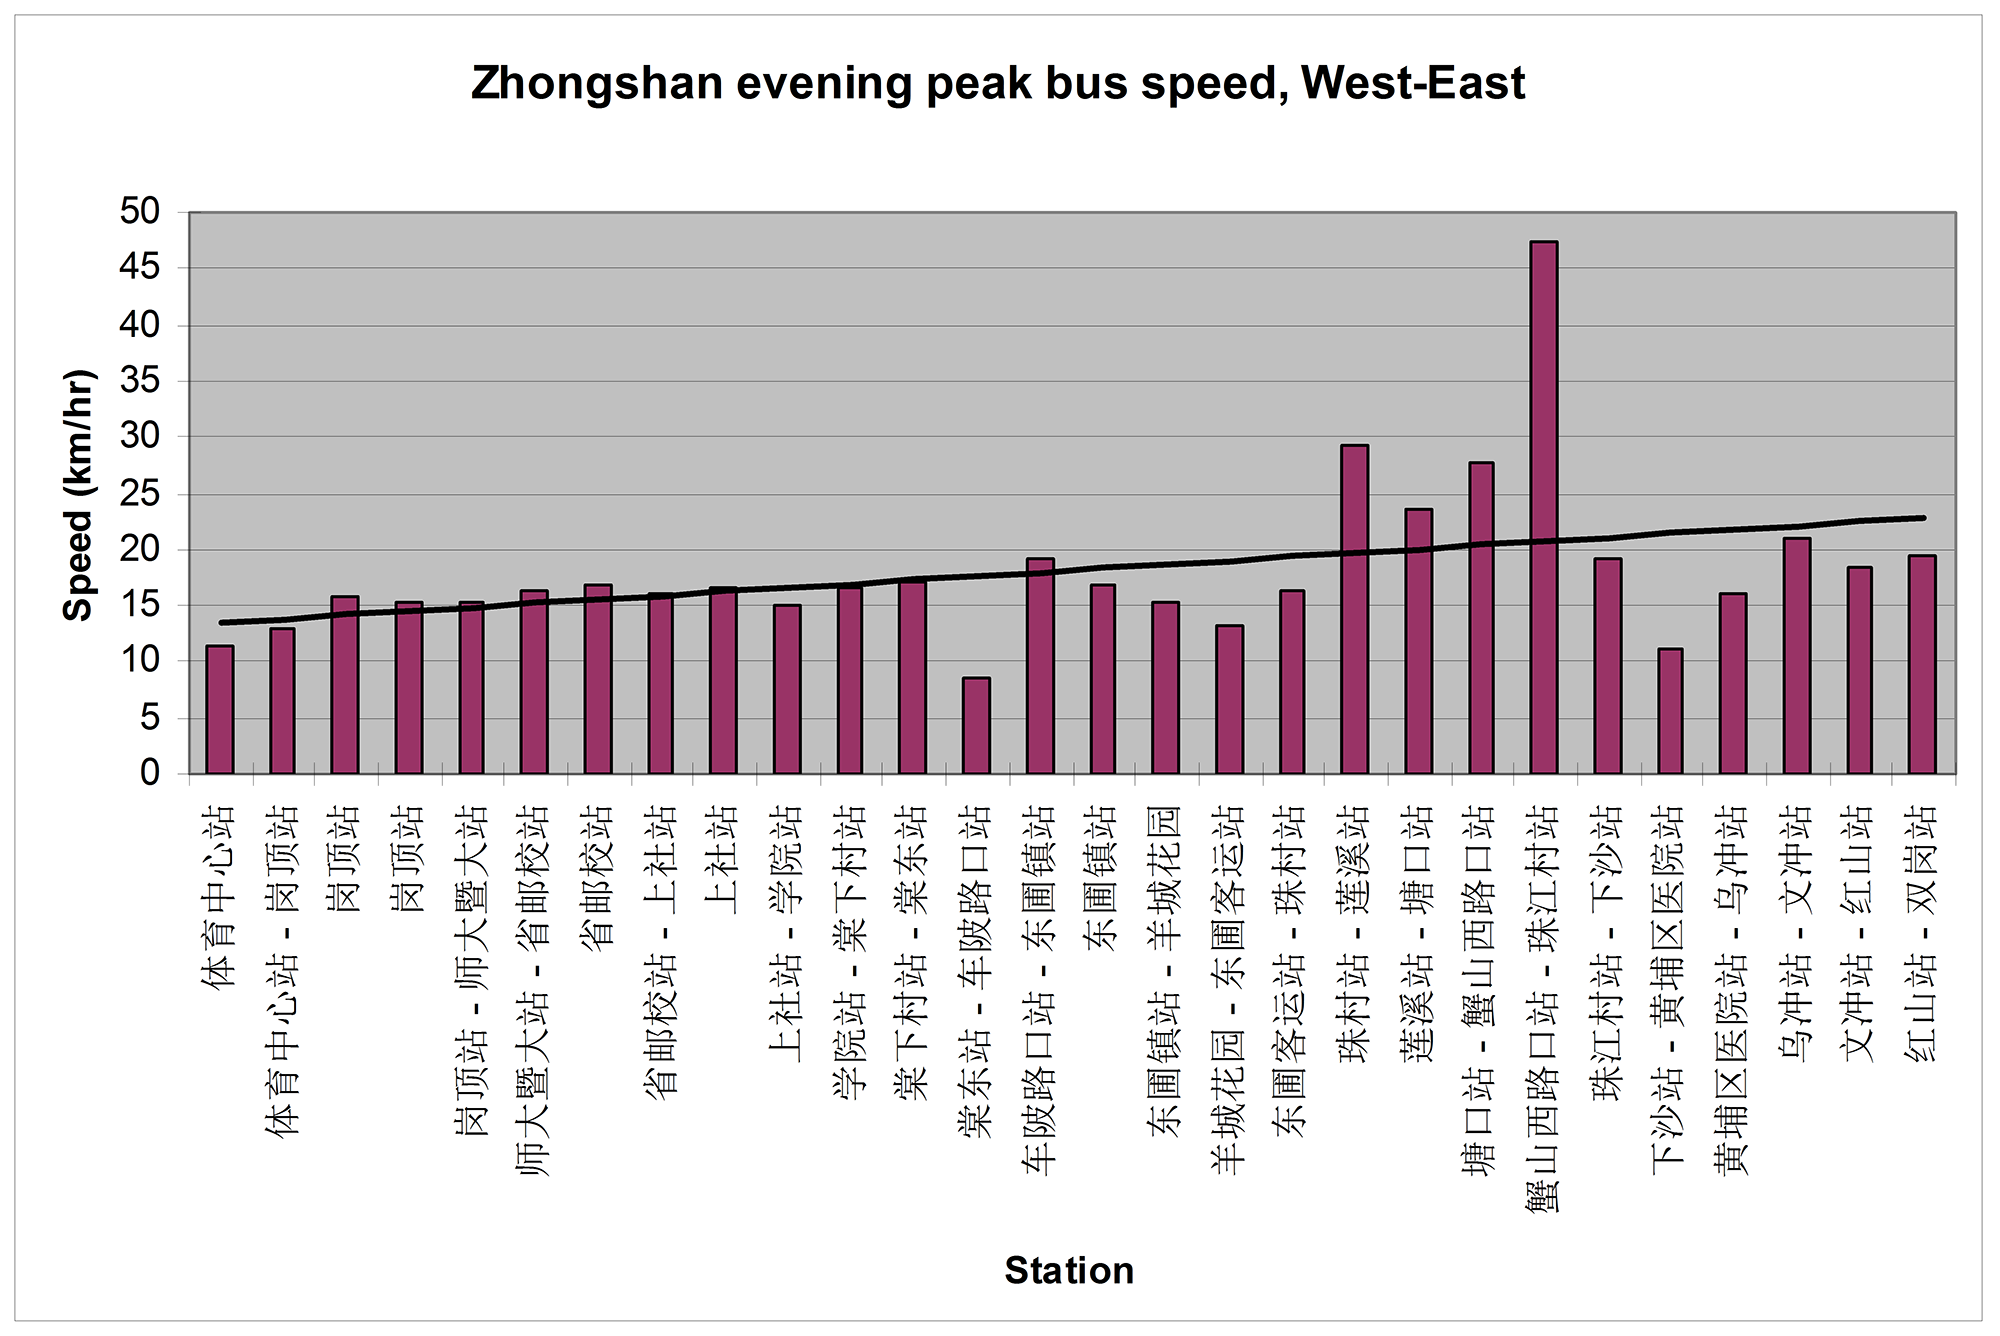
Planners still need to make certain assumptions about how many new customers are likely to be attracted from other modes. To get a robust estimate requires a transport model, but an important clue will be the existing bus and private vehicle speed data. If existing public transport speeds are already at or above 26 kph, it can safely be assumed that the new system will not provide a significant time savings benefit. This lack of time savings will limit the number of new customers attracted to the system, although customers may be attracted for other reasons (safety, security, comfort, fare price, etc.). The lower the existing public transport speeds, the higher the projected modal shift (Figure 4.21). This also extends to private vehicle speeds—if speeds are low and travel times long, people are more likely to find BRT convenient and efficient.
Another factor to consider when estimating a likely modal shift is the existing modal split. In cities where public transport trips make up a small fraction of total demand, but shared taxis, minibuses, or three-wheelers make up a large share of trips, the potential modal shift is likely to be greater than in systems where the vast majority of trips are already made by bus.
A final factor is the system design’s effect on mixed-traffic levels of service. If the project sponsor adopts a design that significantly degrades the mixed-traffic level of service yet significantly improves the speed of bus customers, the modal shift will also be higher. Normally, engineers try to avoid this impact, but there are occasional bottleneck situations where tough choices are hard to avoid.
Projecting the modal shift using traffic modeling is sufficiently complex that simple rules of thumb may not be nearly as reliable. In BRT systems with speeds at or above 20 kph and considerably above previous bus speeds, the demand will be from 5 to 20 percent higher than the baseline demand for the existing bus system. It is unlikely that short-term modal shift will be more than 25 percent of the baseline demand from existing public transport trips, though the system should be designed to accommodate an increase of 50 percent above existing public transport demand.
However, in cases of uncertainty (for example, a large number of difficult-to-count shared taxi trips, or a deteriorated bus system that is underused), designing the system to accommodate as much as a 100 percent increase in ridership, or use of full demand modeling, is recommended.
If the majority of the vehicles on the corridor are buses, then the traffic benefits of the project will be broadly distributed between both bus customers and mixed traffic, but the modal shift impact will be less. If the majority of the vehicles on the corridor are private vehicles, then a busway will tend to have a stronger adverse impact on mixed-traffic speeds, a stronger positive impact on bus speeds, and therefore a bigger potential modal shift impact.
Making a final determination about potential benefits of the system and potential mode shift requires additional information about current vehicle speeds and congestion points.
Table 4.2 provides estimates based on observed impacts in BRT systems around the world. These estimates consider only the vehicle mix on each corridor and the level of congestion on those corridors.
Table 4.1Projected modal shift impact based on type of BRT corridor
| Type of BRT Corridor | Projected Modal-Shift Impact from Private Vehicles |
|---|---|
| Little congestion, buses > 30 percent of the vehicle fleet | 5 percent |
| Some congestion, buses around 25 percent of vehicle fleet | 10 percent |
| Many links congested, buses around 15 percent of vehicle fleet | 15 percent |
| Very congested, few buses on the corridor | 20 percent |