14.3Model Structure
14.3.1General Recommendations and Best Practices
When developing a financial model, or any model, for that matter, in MS Excel, the structure and ease of operating the model is almost as important as the accuracy of the information put into the model. As the model is developed, it becomes progressively more complex, with more information, and unless a rigid method of structure and disposition is employed, it becomes difficult to use and the propensity for errors and coding mistakes increases. A similar analogy is used by the valued 5S workplace organization method that argues that there is no reason to say that a dirty auto repair store should not repair one’s car satisfactorily, but also no reason to say that cleaning it up would not aid the repair process. In other words, a cleaner, better structured model helps the development process, even more so by the fact that, differently than in the auto repair analogy, many people will use and interact with the model.
As a general recommendation, the model should be built as cleanly and be as structured as possible, with the objective of it being intended for use by third party individuals that may not share the same financial understanding or modelling experience. It is very common to see Excel coding mistakes. These best practices, although not obligatory, aim to minimize the occurrence of such mistakes.
14.3.2Row/Column Disposition
MS Excel, by nature, is a hybrid of a database, a worksheet, and, to some, a notepad. To cater to the three purposes above, it is important to separate the worksheets by type of information and purpose.
The most important recommendation regards the horizontal/vertical disposition or segregation of the information. Since Excel has many more rows than columns, and the human eye is trained to read documents and information vertically, the proposition is to horizontally separate all information. In other words, no two different pieces of information or subjects will be horizontally adjacent. Hence, if one is to read or go through the model, one may navigate vertically and all information will be segregated. Certain premises require many rows and columns to determine a single value.
14.3.3Grouping Hierarchical Principles
The second step is to make sure that all information is grouped hierarchically. It is important to follow a scientific/pyramid principle approach, grouping items related to the same subject together. For instance, an Opex premise should not be contained within a Capex section. Likewise, the same premise should not appear in two different sections of the document.
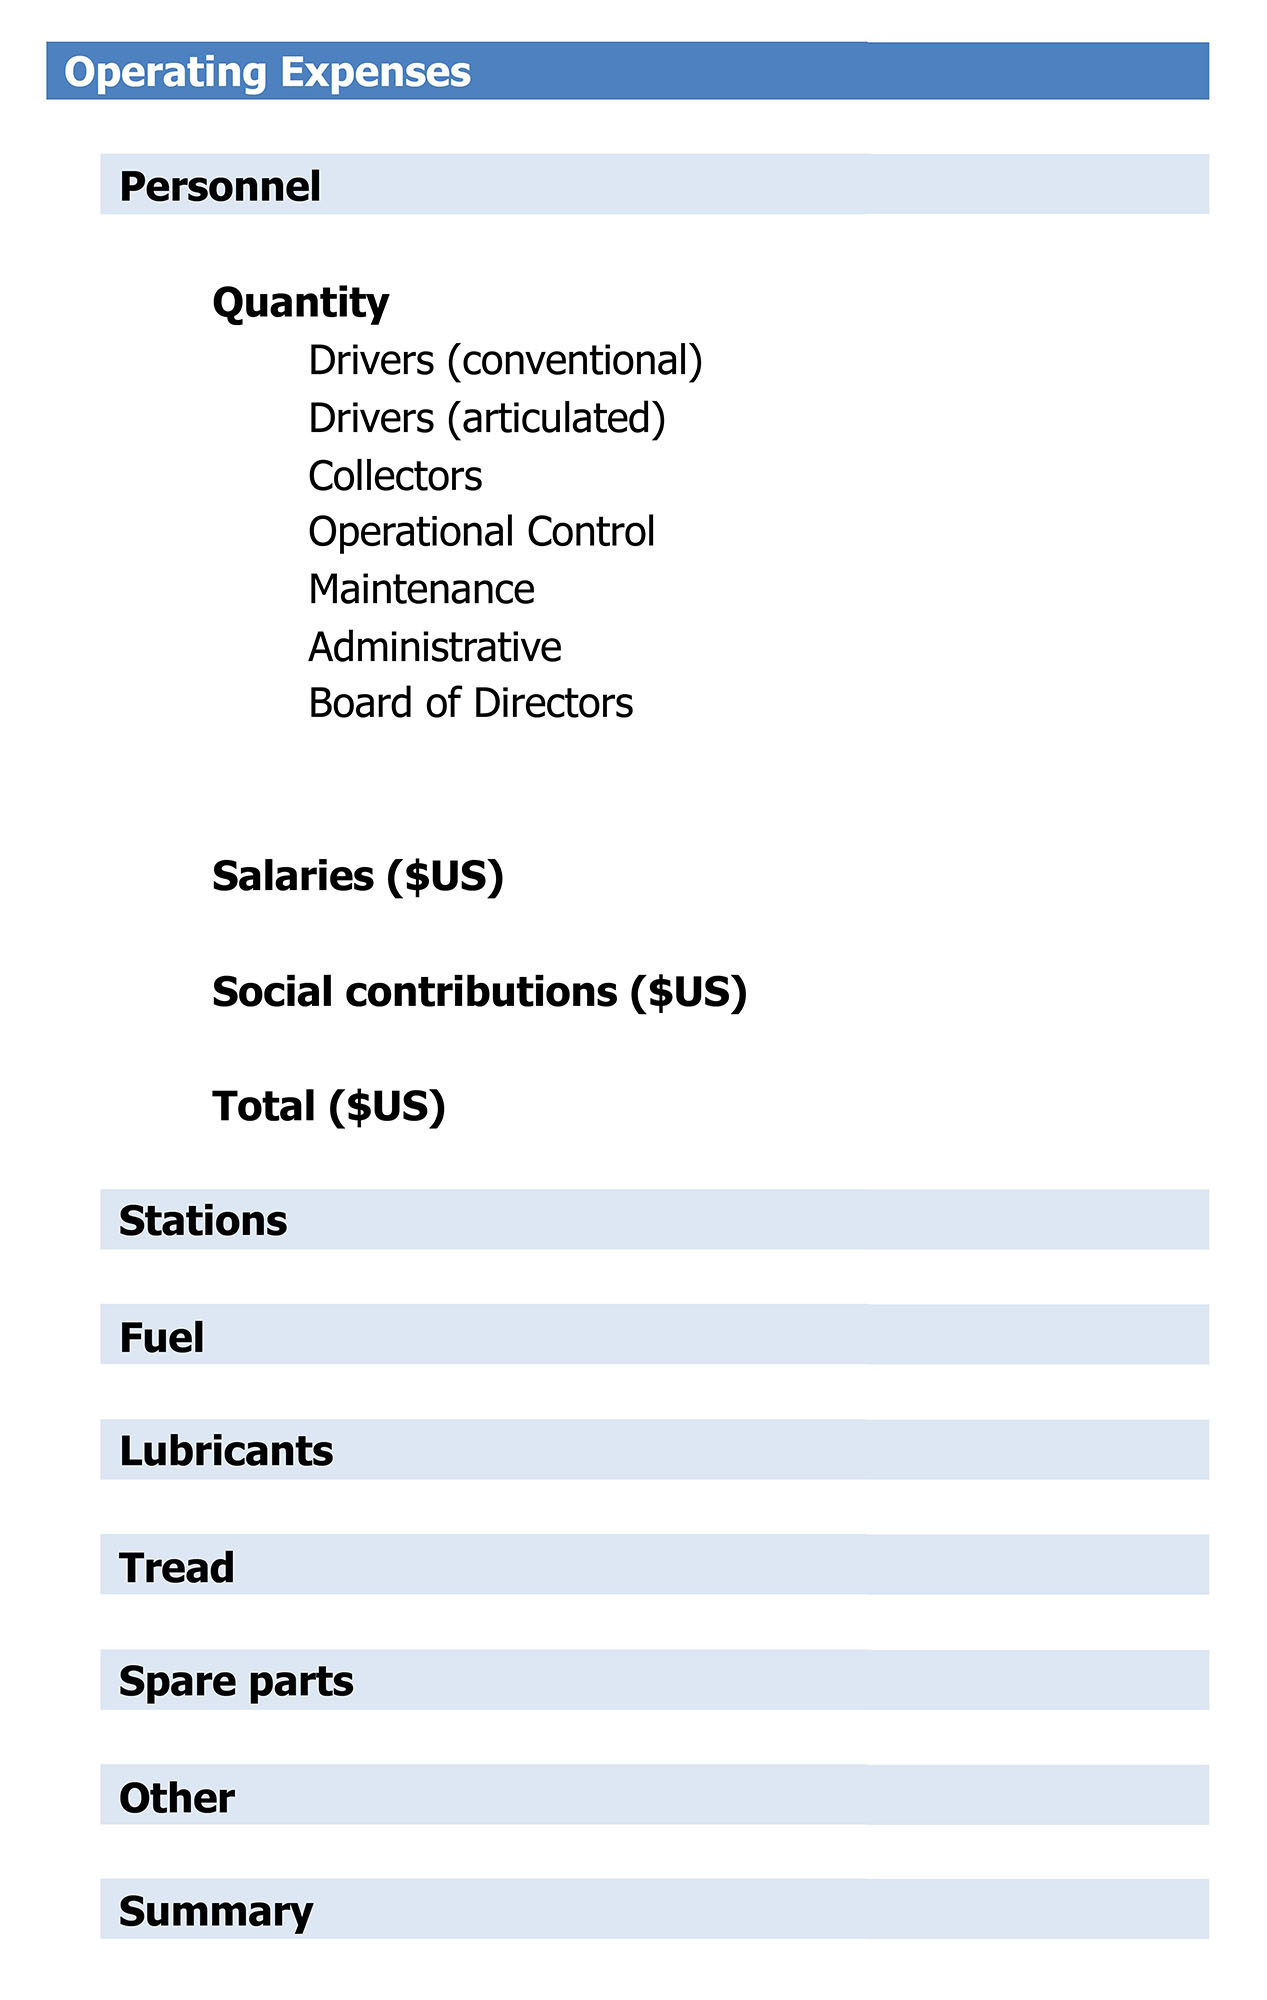
As an example, this type of grouping may be done utilizing the different columns to the right. For instance, each “group header” would be placed on the same column, with each subsequent group or indentation occupying progressive columns to the right as shown in Figure 14.3. This gives structure to the document and allows for a simpler understanding of the assumptions.
14.3.4Temporal Characteristic of Information
In addition to this, a universal and intrinsic characteristic of all information is its temporal quality. The information can be divided into time-based and non-time-based information. Time-based assumptions could be either displayed vertically or horizontally. However, given the above principle of segregating different types of information vertically, one should display the evolution of this time-based information horizontally. Once the information is displayed horizontally, it becomes easy to notice that all temporal information has as its header the “year” information. Thus, it is convenient to size all temporal columns the same. A problem with this is that non-time-based information, such as single premises and specific databases, possess different headers that require different sizes to allow for greater legibility. This brings about a width mismatch and, as such, it is recommended that time-based and non-time-based information be displayed in different worksheets.
As an additional recommendation for both non-time-based and time-based assumptions, all numeric data and information that is not a label or a textual explanation should begin upon a specific column going forward. This helps debug the model, since all parameters, specifically time-based parameters, will possess the same column reference for each year.
14.3.5Units
As a best practice, it is recommended that the dimension of units (hundreds, thousands, millions) in the model follow the same structure. For non-time-based assumptions, the recommendation is to keep the unit in its most convenient dimension. For instance, a fuel consumption parameter makes sense to be displayed as liters per kilometer, not as liters per thousand kilometers. Likewise, the price of diesel makes sense being displayed as U.S. dollars per liter, not as thousands of U.S. dollars per liter. However, once these assumptions are multiplied and we reach total yearly values in costs, it becomes convenient to display all yearly values in thousands. Therefore, all values in time-based sheets are expressed in the same unit dimension, which is a simple and convenient best practice.
14.3.6Color Coding and Sheet Naming
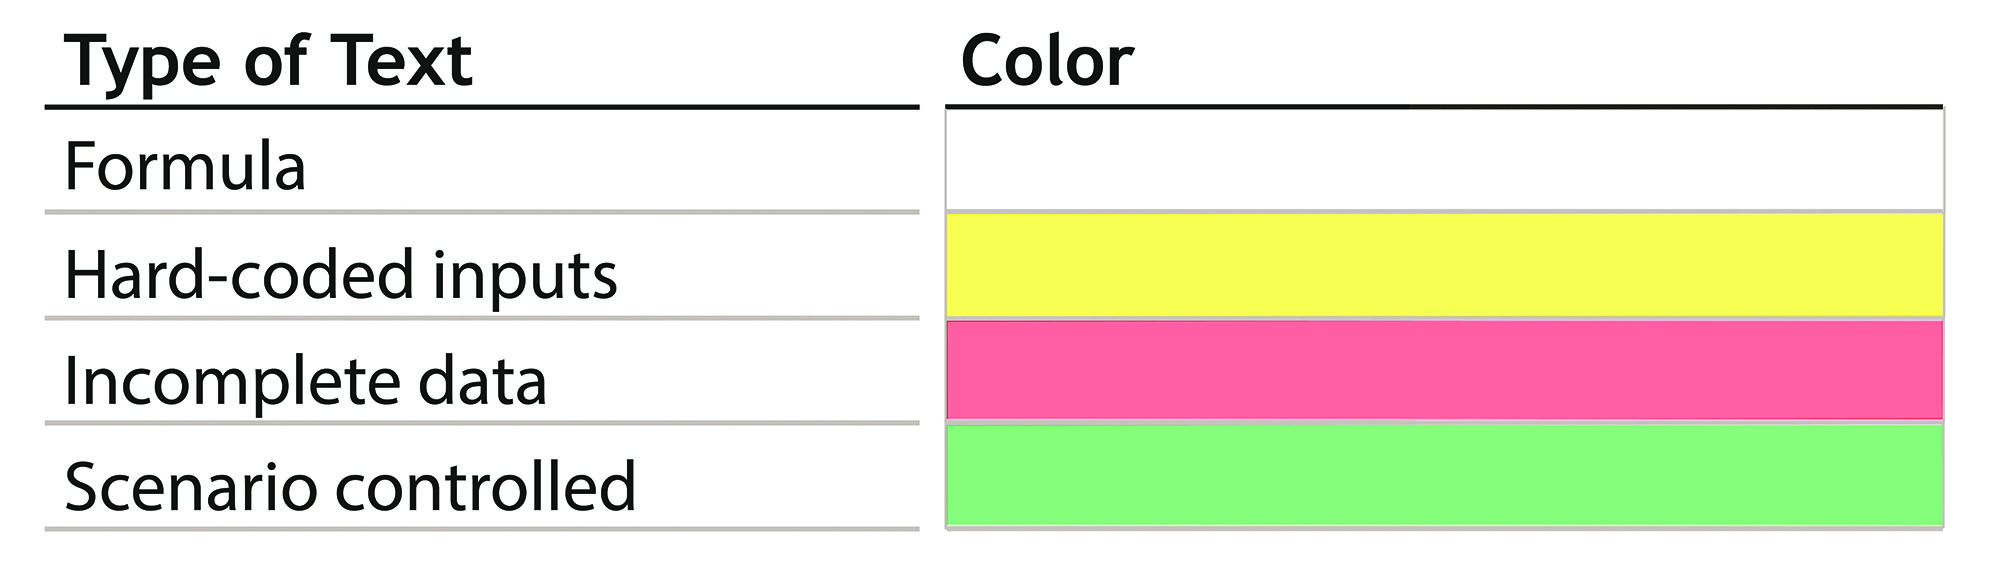
In order to facilitate the model understanding, it is recommended to color code it according to its status (as shown in Figure 14.4):
- Formula: the cell’s content is derived from a formula. Since this is the most common occurrence, keep it white;
- Hard-coded inputs: parameters inserted by the model. Figure 14.4 suggests yellow for this type of text;
- Incomplete data: in case some of the data is preliminary or must be reviewed, it is important to indicate that by coloring the cell red;
- Scenario controlled: in case the cell is a formula and is controlled by a specific scenario option that may be set in a control panel. Figure 14.4 suggests green for this type of text.
Since many formulas will be referenced across different sheets in Excel, it is practical to name these sheets with the shortest name possible, so as to facilitate reading cell formula constructions (see Table 14.1). To that end, it is important to name the cells without numbers or spaces, or else Excel treats the sheet name as a “string” and references it in quotation marks. This is both cumbersome to work with, since the cell formula will now occupy more space, and may produce some complications in case one were to use the replace commands embedded in Excel.
Table 14.1Information Separation Sheet Division
| Sheet | Description |
|---|---|
| Info | Control of the information |
| CP | Control panel |
| sNTB | System - Assumptions not based on time |
| sTB | System - Assumptions based on time |
| sFin | System - Financial statements |
| bNTB | Buses - Assumptions not based on time |
| bTB | Buses - Assumptions based on time |
| bSFAF | Buses - Schedule of financing + fixed assets |
| bFin | Buses - Financial Statement |
| tNTB | Technologies - Assumptions not based on time |
| tTB | Technologies - Assumptions based on time |
| tFSFA | Technologies - Financing schedule + fixed assets |
| tFin | Technologies - Financial statement |
| agNTB | BRT Agency - Non-time-based assumptions |
| agTB | BRT Agency - Time-based assumptions |
| agFSFA | BRT Agency - Financing schedule + fixed assets |
| agFin | BRT Agency - Financial statement |
| KPIs | Key Performance Indicators |