21.4Infrastructure Costing
You and I come by road or rail, but economists travel on infrastructure.Margaret Thatcher, former UK Prime Minister, 1925–2013
Infrastructure capital costs can consist of both construction costs and any related land or property acquisition costs. Based on the preferred design characteristics, in conjunction with the size of the initial phase of the project, a city can determine if the capital cost estimates are in line with realistic financial resources. Several iterations of physical designs and service planning are likely before finding a balance between system cost and system performance.
21.4.1Costing Techniques
The limited number of BRT systems to date, combined with the lack of a shared costing database, makes local estimations of infrastructure costs difficult. However, there are a few options for developing an initial estimate of infrastructure costs. These options include developing estimates based on:
- Costs from BRT systems in other cities, with adjustments based on local design and macroeconomic factors;
- Similar past projects in similar areas of the municipality. Such projects could include road expansion efforts and previous bus-improvement measures;
- Informal discussions with local contractors and engineering trade associations;
- Survey work by consultants, which may incorporate all of the above estimation techniques;
- Comparisons of cost projections against actual costs of other projects.
21.4.2BRT Cost Calculator
Based on cost data from existing developing-nation BRT systems and inputs from BRT experts, a BRT cost calculator has been developed to give cities an initial estimation of infrastructure costs. Actual costing will depend much on local conditions and circumstances. However, the BRT cost calculator is useful in alerting project developers to the costing items that should be considered in planning a system. The BRT cost calculator is based on 2011 costs in U.S. dollars, so construction cost escalation, exchange rate variation, and other financial factors should be taken into account when utilizing this tool. The actual cost calculator can be accessed on the ITDP website and Appendix B at the end of this guide.
In order to demonstrate infrastructure costing, we provide an example of a preliminary budget prepared for a hypothetical BRT system. Using the infrastructure-maintenance section of the cost calculator, costing is estimated for a hypothetical Phase I project of fifty kilometers of trunk infrastructure.
The methodology utilized assesses the anticipated maintenance costs associated with each infrastructure element over a thirty-year period, and then yields an average annual maintenance cost for the system.
Typically, maintenance for the first year after completion of the construction contract is undertaken by the contractor as part of its defects-liability period. Thereafter, the local municipality (or BRT entity) will need to maintain the infrastructure for the duration of the project.
The objective of the cost calculator is to provide designers and decision makers with an idea of maintenance costs that can be expected once a system is built. The calculator can assist with the choice of materials for construction, as it takes into account life-cycle costs.
Table 21.1 summarizes the subtotals from each of the maintenance costing categories. The total infrastructure maintenance budget projected for this hypothetical project for a thirty-year period comes to approximately US$180 million, which equates to approximately US$6 million per annum (or 1.4 percent of total construction costs) and US$120 thousand per kilometer of trunk services. Note that these costs are based on interviews conducted with professionals involved in infrastructure maintenance in the Cape Town, South Africa, municipal area. The percentages utilized are best estimates of the potential maintenance costs of the different infrastructural components of a BRT system. Actual costs may vary widely from region to region.
Table 21.1Summary of System Infrastructure Maintenance Costs (Phase I Project of 50 kilometers)
| BRT Infrastructure Elements | Total Maintenance Costs (US$) for 30 year Period | Average Annual Maintenance Costs (US$) | Average Annual Maintenance Costs (US$)/Busway km | Total Maintenance Costs (US$) for 30 year Period/Total Construction Cost | Average Annual Maintenance Costs (US$)/ Total Construction Cost |
|---|---|---|---|---|---|
| Trunk busway infrastructure | $112,700,115 | $3,756,671 | $75,133 | 62% | 2.07% |
| Trunk stations | $32,115,567 | $1,070,519 | $21,410 | 40% | 1.33% |
| Integration | $10,208,626 | $340,288 | $6,806 | 22% | 0.73% |
| Feeder/kerbside services | $14,850,025 | $495,001 | $9,900 | 30% | 1.00% |
| Terminals, depots, and other | $11,280,106 | $376,004 | $7,520 | 15% | 0.51% |
| TOTAL | $181,154,439 | $6,038,481 | $120,770 | 42% | 1.40% |
21.4.3Value Engineering Process
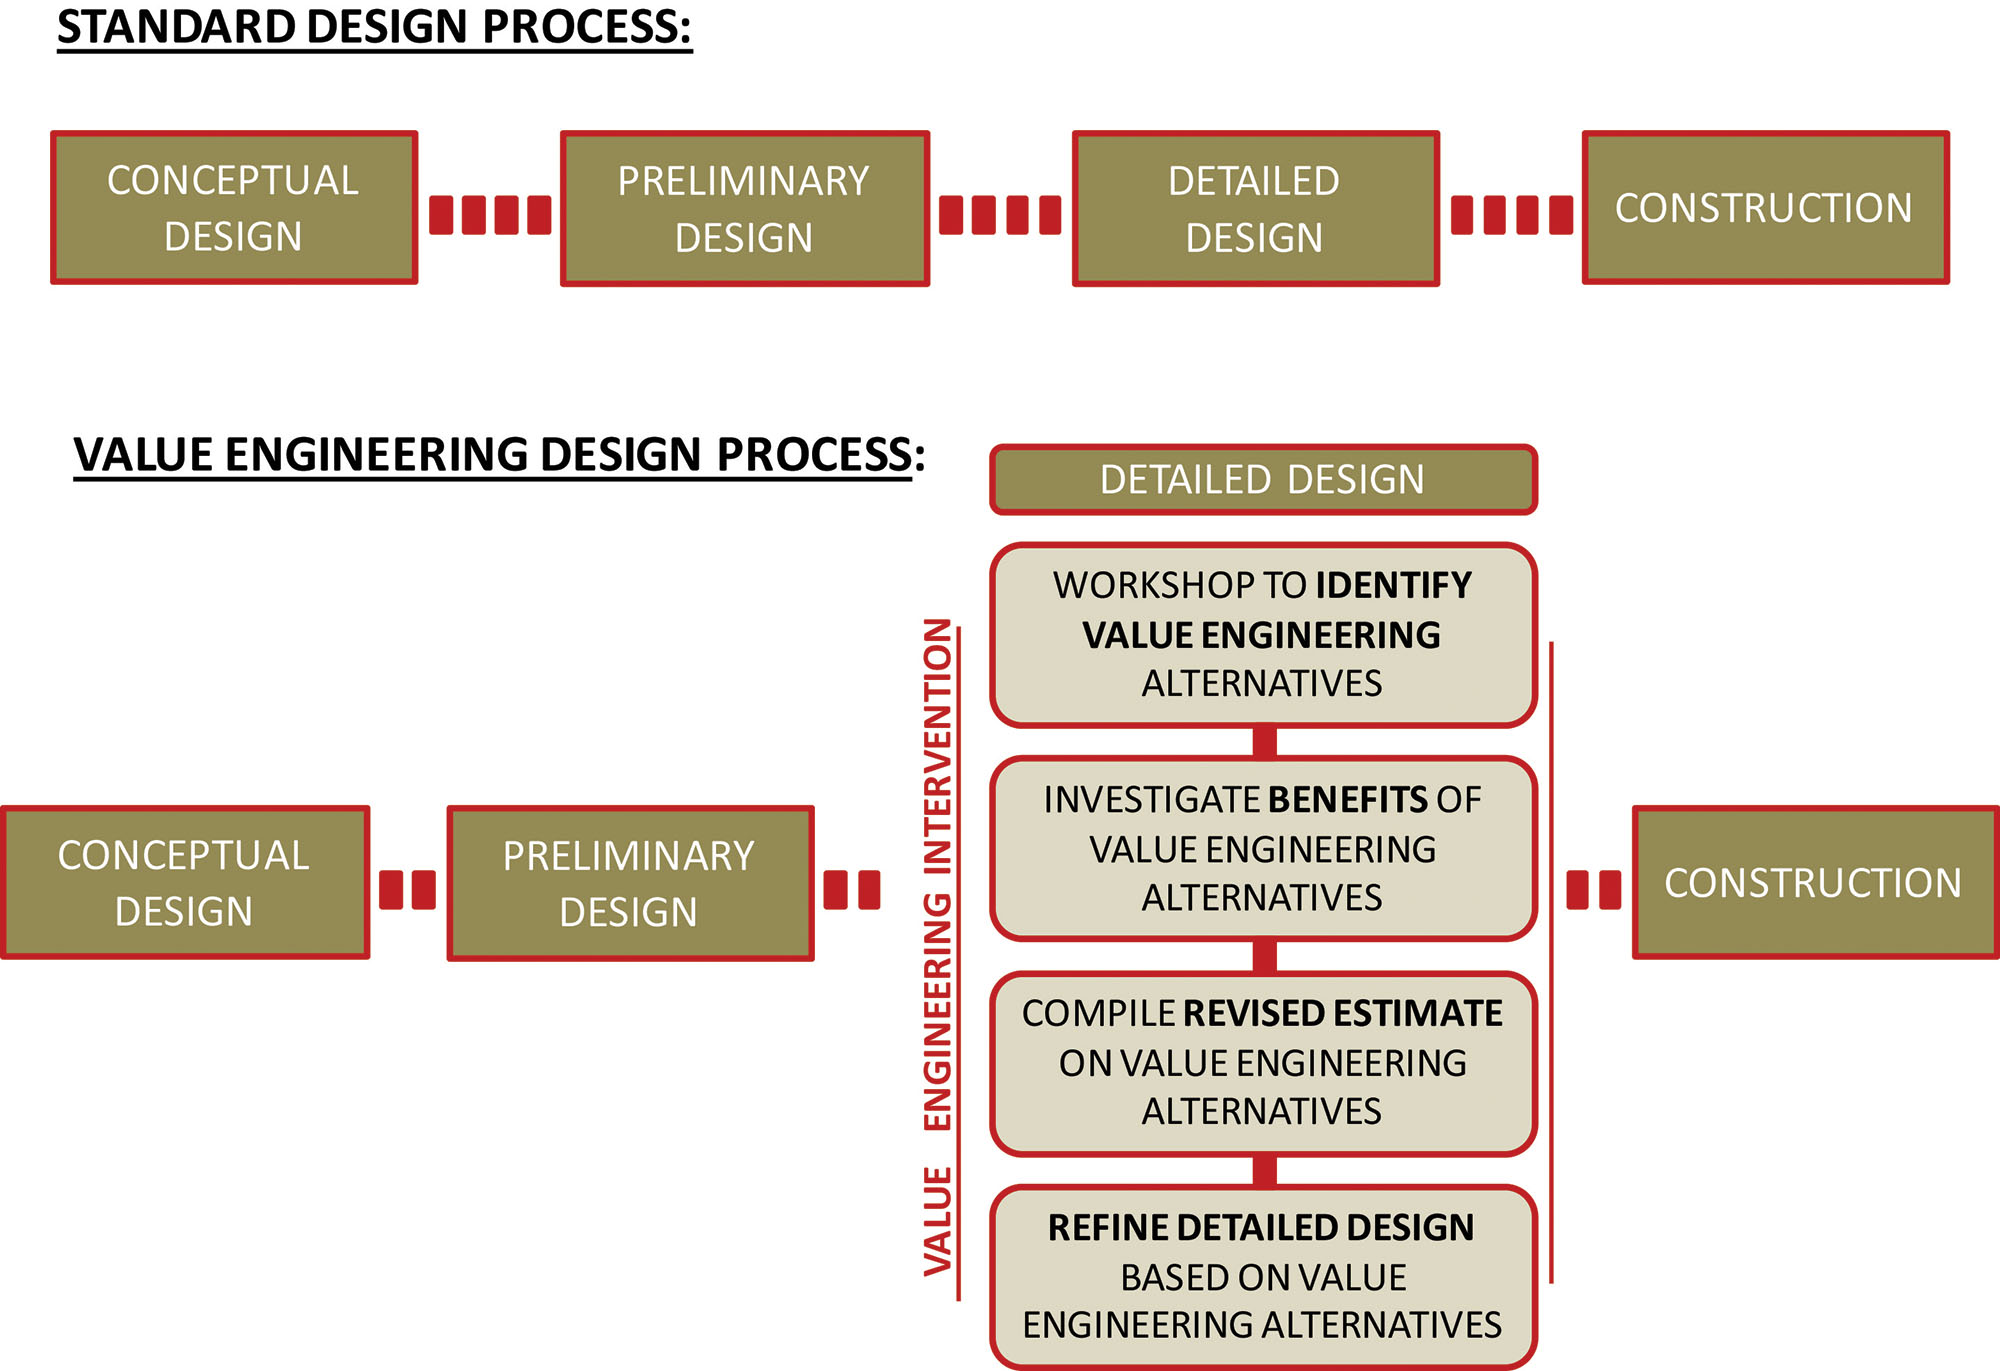
A value engineering process is in essence an assessment of the design to determine whether there are more cost-effective ways of achieving the operational objectives using lower-cost infrastructure elements or alternative designs.
Value engineering can also take place during the preliminary and detailed design stages. Here the value engineering process takes the assessment deeper to interrogate whether there are more cost-effective materials or elements that can be used to minimize overall cost, with minimal reduction in quality (Figure 21.13). Life-cycle costing of materials form a major part of value engineering.
Once a portion of infrastructure is constructed, a value engineering exercise could be undertaken to input lessons learned from the construction phase into how costs could be reduced in future phases of the BRT project. These could include construction methods, proven new technologies, the use of smaller BRT vehicles to minimize pavement loadings, etc.
21.4.4Capital Cost and Operating Cost Options
In most BRT systems, the distinction between capital costs and operating costs is important from the standpoint of public versus private investment. The public sector generally provides the capital investment just as it typically funds roadways for private automobiles. Many BRT systems utilize private operators to cover operating costs, and thus such operators obtain access to revenues from fare collection. Some costs, such as vehicles and fare collection equipment, do not automatically fall into either category, and thus the assignment of these costs can depend on local circumstances (see also Chapter 17: Finance Plan).
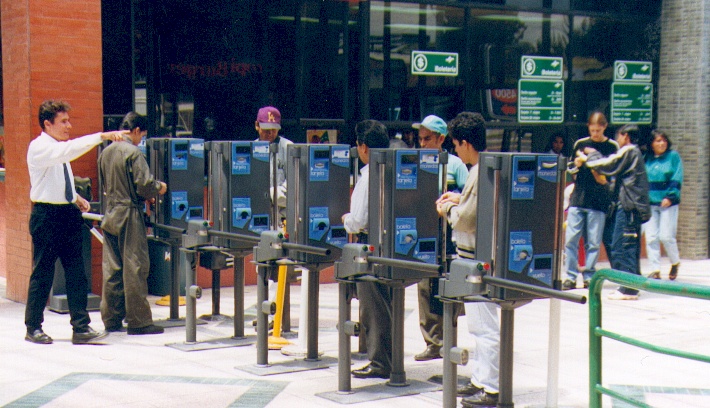
There are circumstances when some elements of the BRT system may be strategically moved between capital and operational cost categories (Figure 21.13 ). Some systems have room for higher fare levels and may prefer to reduce their capital borrowing for the initial system infrastructure. In such instances, putting some elements of equipment into the operating cost category can make sense. For example, Bogotá required the private firm with the fare collection concession to include the electronic turnstiles and smart cards as part of the operational bid. The private fare collection firm thus reduces the cost of this infrastructure through its share of the fare revenue. In effect, the concessioned firm is acting as a financing agent for the particular piece of infrastructure.
There are instances when some elements of the BRT system may be strategically moved between capital and operational cost categories. Typically, this situation arises when fare affordability in lower-income countries becomes a significant issue. Since the cost of vehicles and fare collection equipment will likely not be appreciably different between a low-income and middle-income nation, the costs of such equipment can put significant pressure on total operating costs in low-income nations. Thus, moving some of these costs to the capital cost category can help permit reasonable fare levels without the need for operating subsidies. However, all aspects of this decision must be weighed carefully, because placing bus procurement with the public sector sometimes results in higher vehicle costs. In most cases, vehicles will cost less if they are procured by the private sector. A more detailed description of this can be found in Chapter 16: Vehicle Operator Contracting.
Moving equipment purchases to the capital cost category can bring with it some unintended consequences. In general, it is best to have the companies utilizing the equipment to pay for it and to maintain it. Companies operating buses that they do not own will tend to not maintain the vehicles properly. Public procurement of equipment can result in many misplaced incentives. A compromise is for the public sector to share costs with the private sector. For example, the public sector may provide 50 percent of the vehicle cost while the private firm must pay off the other 50 percent through fare revenues. In this way, the private firm still has an incentive to properly maintain the vehicle, but the reduced cost means that pressure on cost recovery is lessened.
In general, it is always best for the private sector to purchase its own vehicles, based on the well-defined specifications developed by the public sector. However, in some instances with low-income nations, it may be necessary to transfer some of the vehicle purchase costs to the capital cost category in order to achieve an affordable customer fare (as was done in Mexico City, along the Insurgentes corridor). It is feasible to transfer the burden of the initial investment from private to public hands and to maintain the efficiency of the private sector. As an alternative to direct public investment in equipment, such as vehicles and fare equipment, the public sector could provide special-condition loans or tax incentives that will reduce the impact of the investment on cash flow and will not get the public sector involved in the actual purchasing process. The key element is to select financial options that will allow the city to achieve affordable fares, maximizing the respective resources and capabilities of both the public and private actors.
21.4.5Land and Property Acquisition
One of the most variable cost items when comparing different BRT systems is the level of land and property acquisition required, especially along the road at stations and terminals due to the greater land requirement.
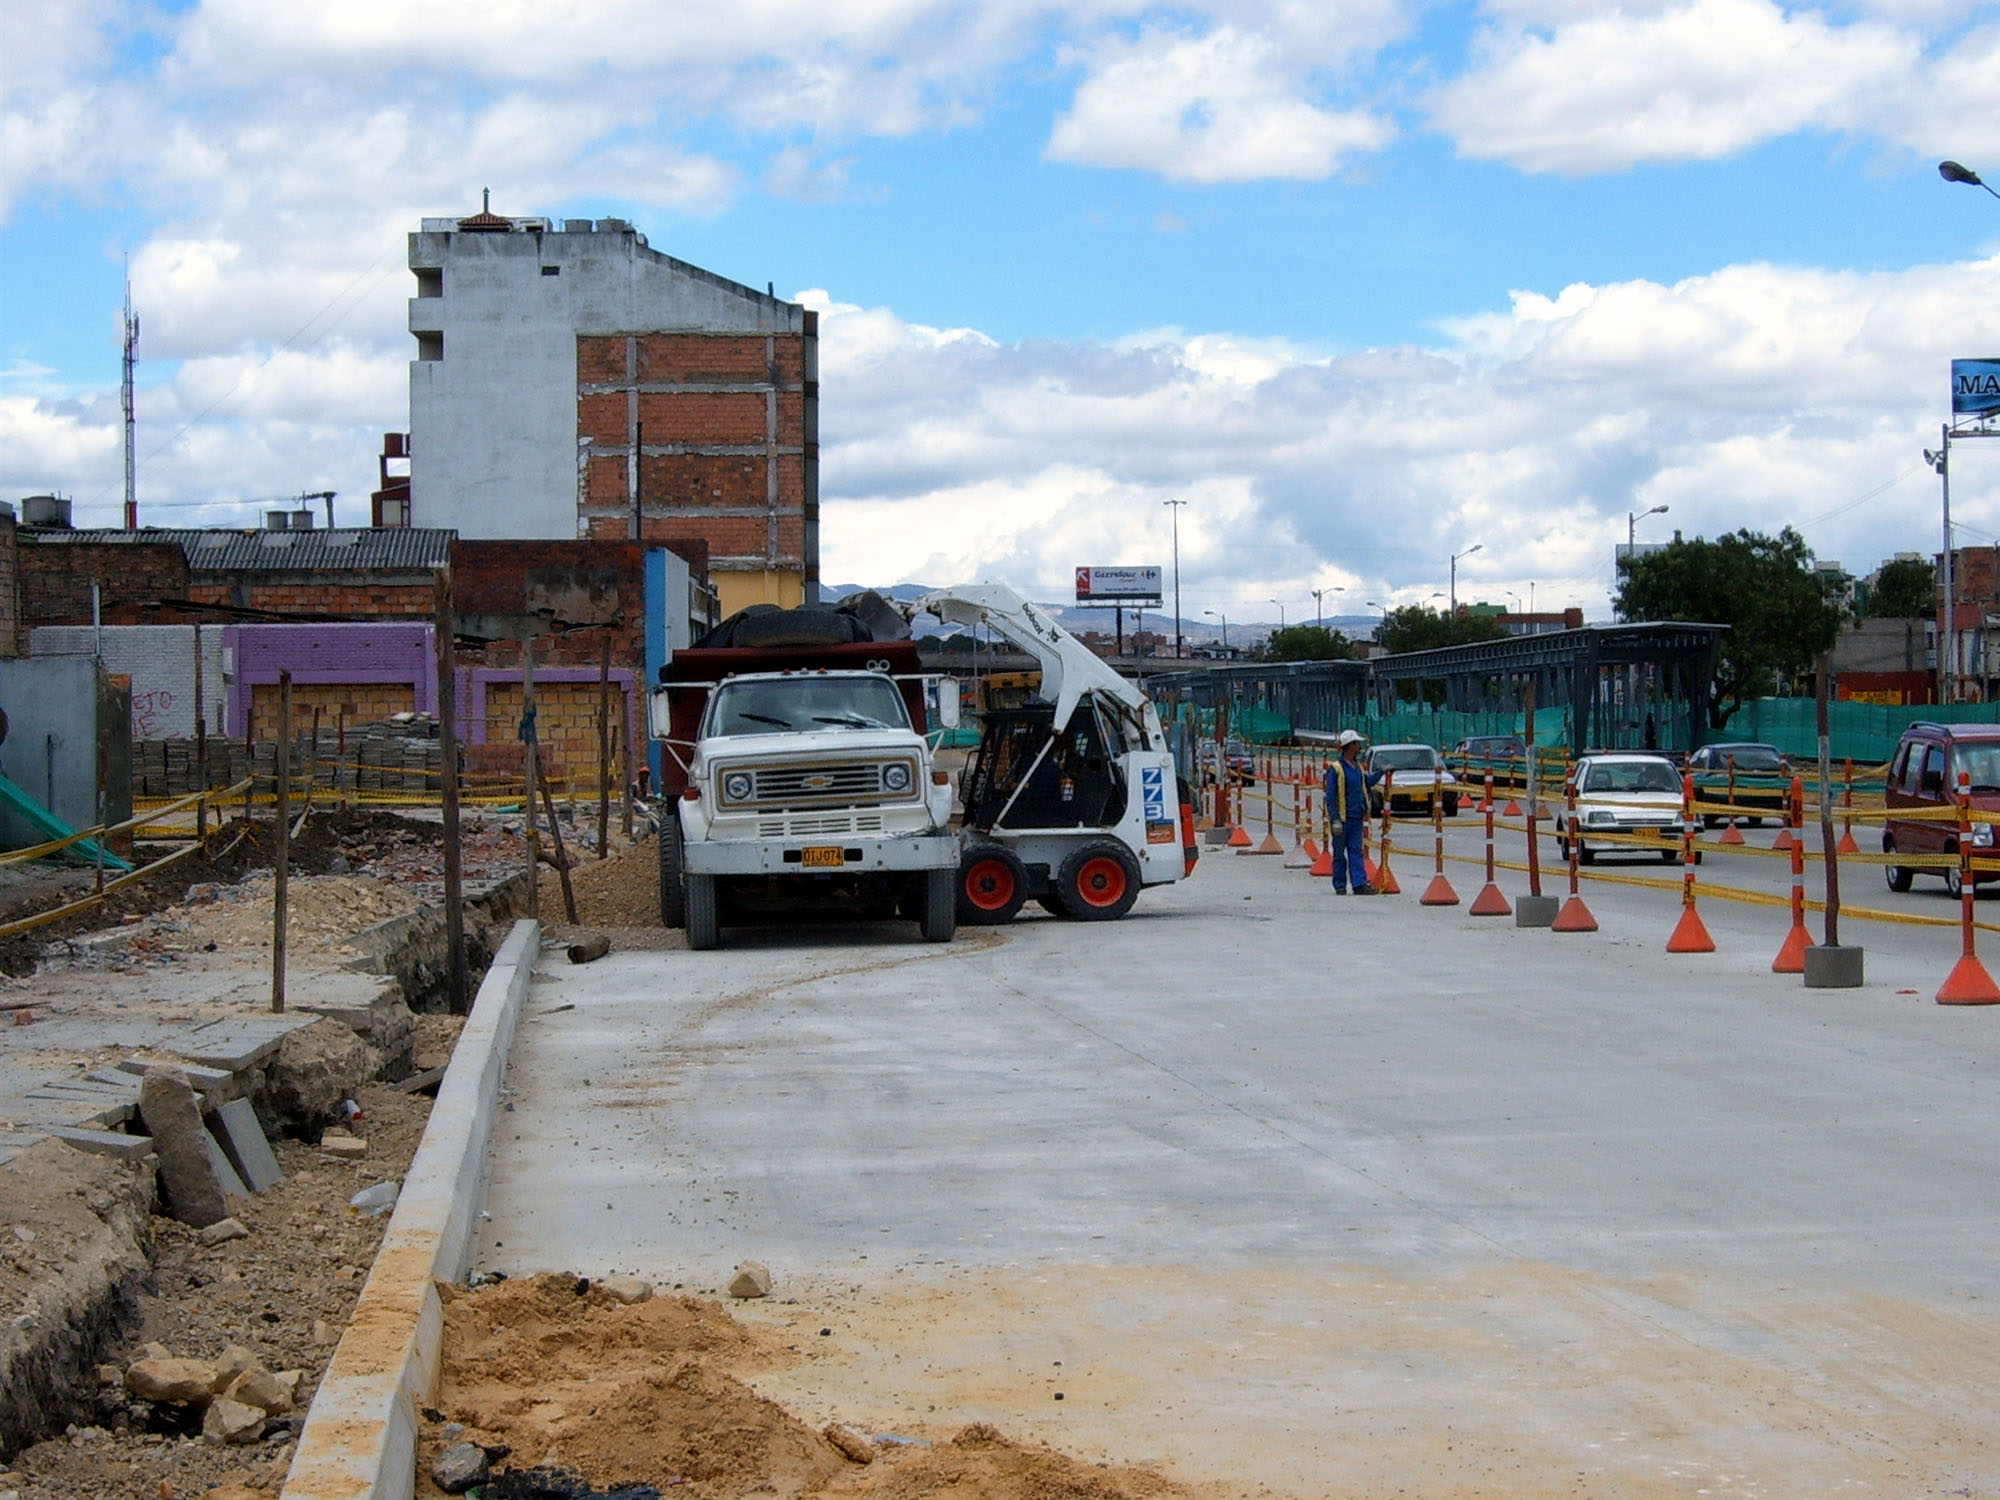
In instances where property purchases are necessary, infrastructure costs can quickly skyrocket. Infrastructure costs on Bogotá’s TransMilenio system jumped from approximately US$5.3 million per kilometer in Phase I to as high as US$15.9 million per kilometer in Phase II. Much of this increase was due to the much greater need for land purchases in the second phase. In Phase I of TransMilenio, approximately 600 plots were purchased. In Phase II, the municipality purchased approximately 4,000 plots (Figure 21.13).
Resettlement can have major impacts on livelihoods. While the homes of residents may be able to be replaced elsewhere—ideally nearby—the livelihoods of residents may be much harder to directly replace due to their reliance on a particular location.
Some characteristics of a well-designed property-purchase program include:
- Clarity in the procedures;
- Transparency and openness of the process;
- Timeliness in processing and timeliness in resolving conflicts;
- An overriding sense of fairness in the process.
The World Bank has developed a set of recommended procedures for compulsory purchase programs in infrastructure projects. Likewise, Bogotá has developed a similar process to fairly deal with property purchases required by the expanding TransMilenio system.