24.2Approach to Intersection Design
Idiopathic, from the Latin meaning we’re idiots cause we can’t figure out what’s causing it.Gregory House, MD (as played by actor Hugh Laurie), “Role Model,” House, 2005
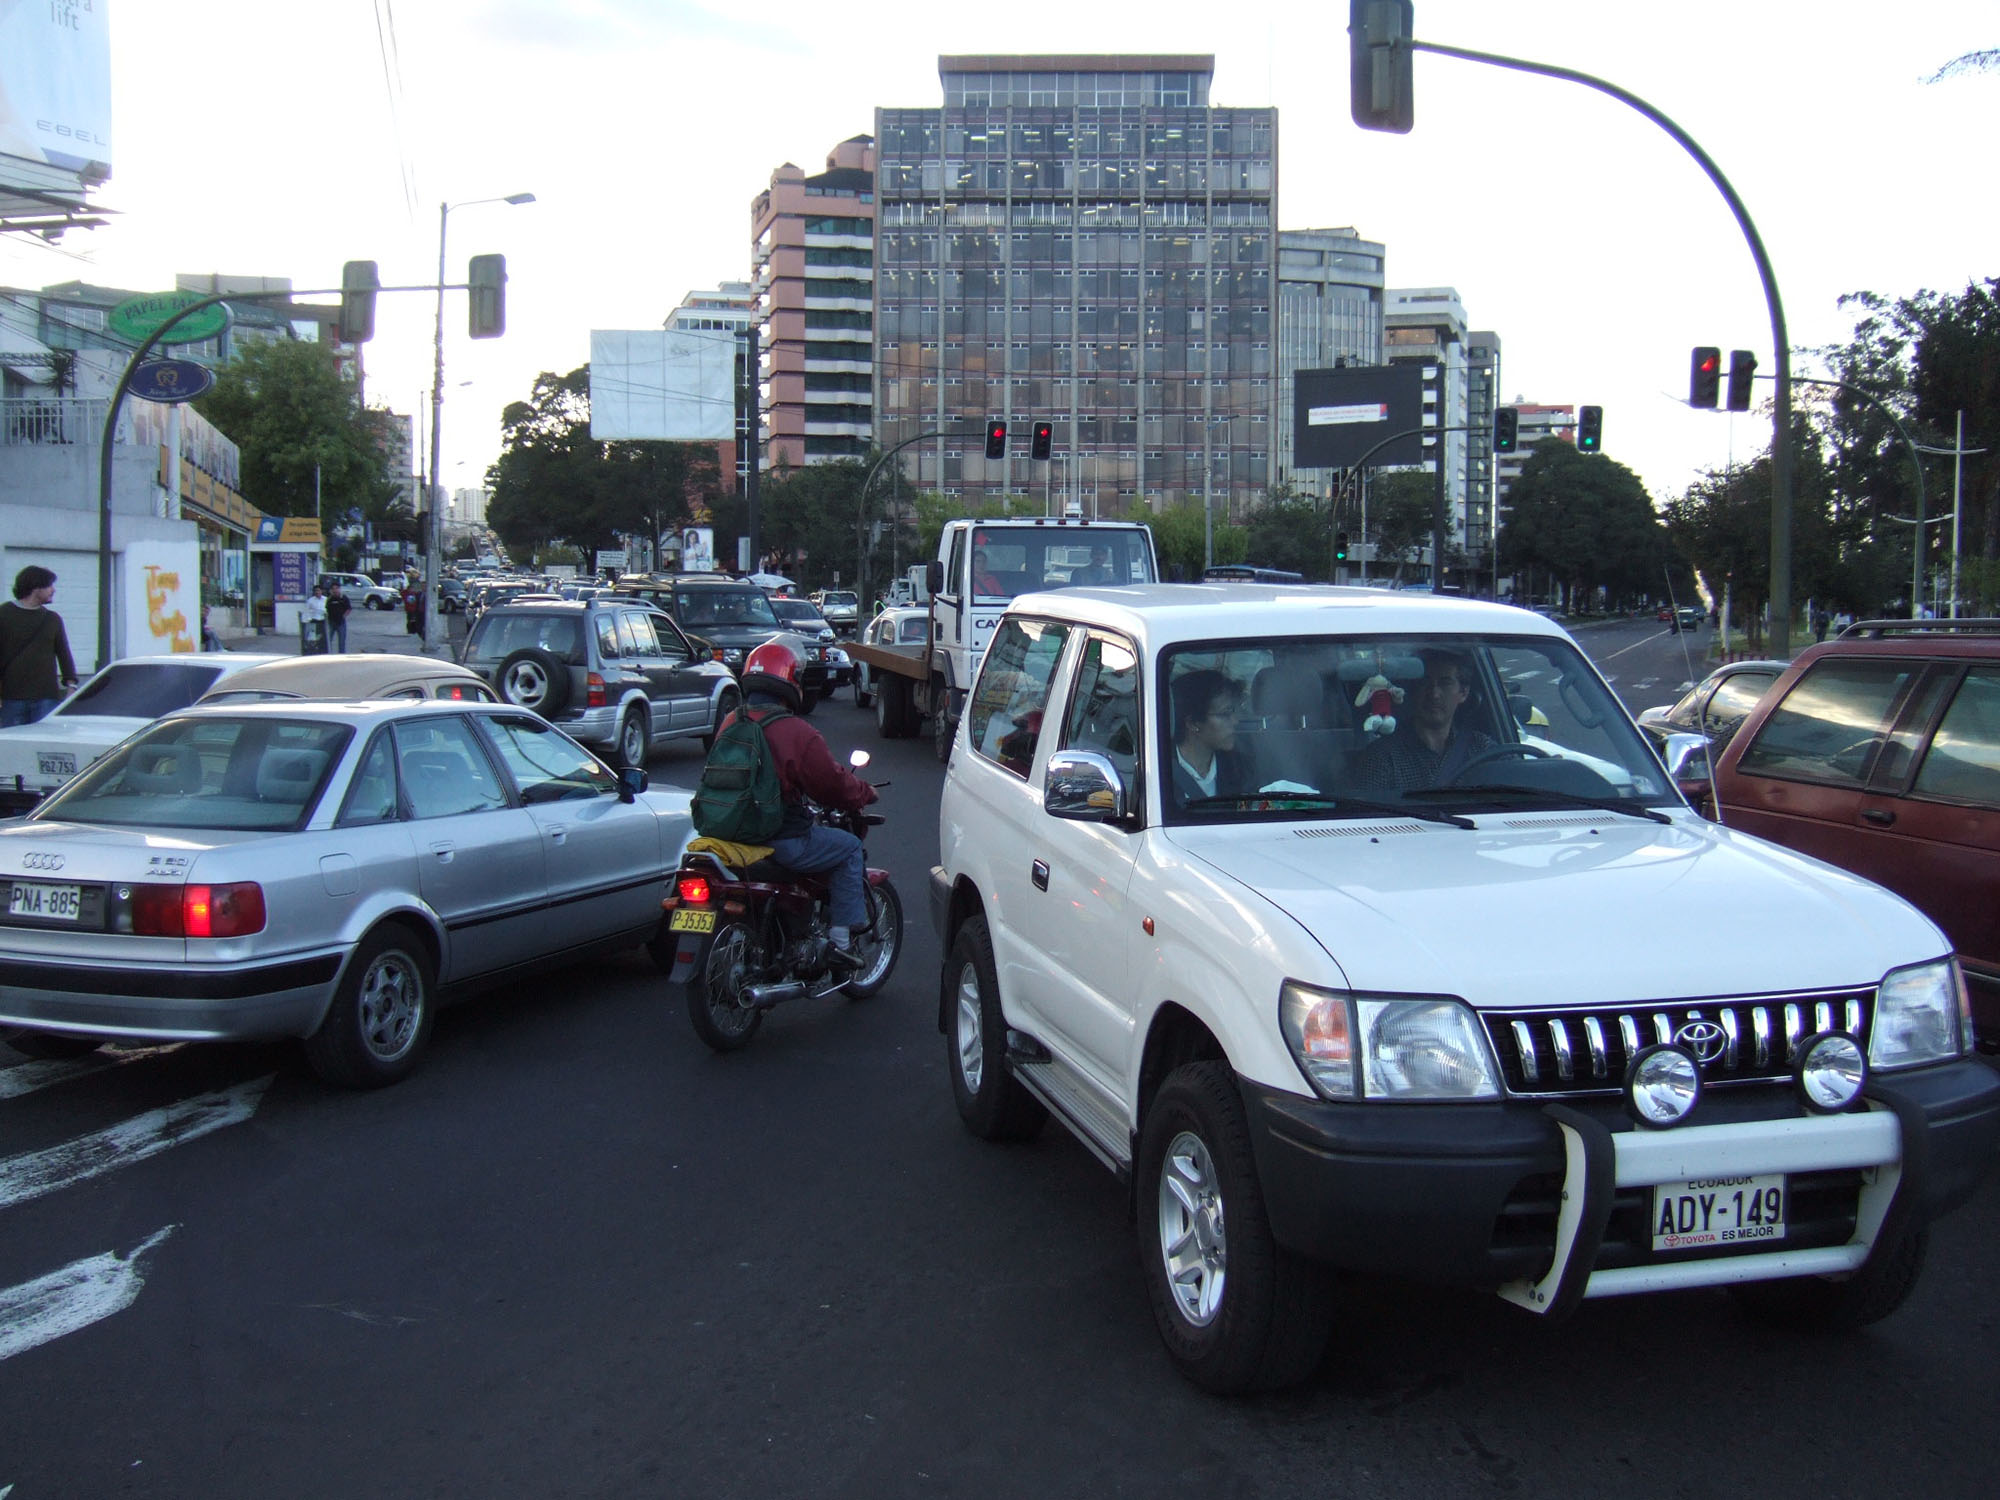
BRT systems are generally built on corridors where mixed-traffic congestion is already a problem, or where congestion is likely to occur in the near future; otherwise there would be no benefit in building a segregated busway. The worse the congestion appears, the greater the benefit of the exclusive busway (Figure 24.11). If a BRT system makes public transport services better but mixed traffic worse, it will be less politically successful than if it makes public transport better and also improves mixed-traffic flow. BRT system planners therefore generally try to minimize adverse impacts on mixed traffic.
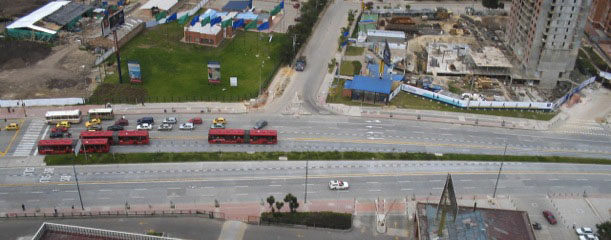
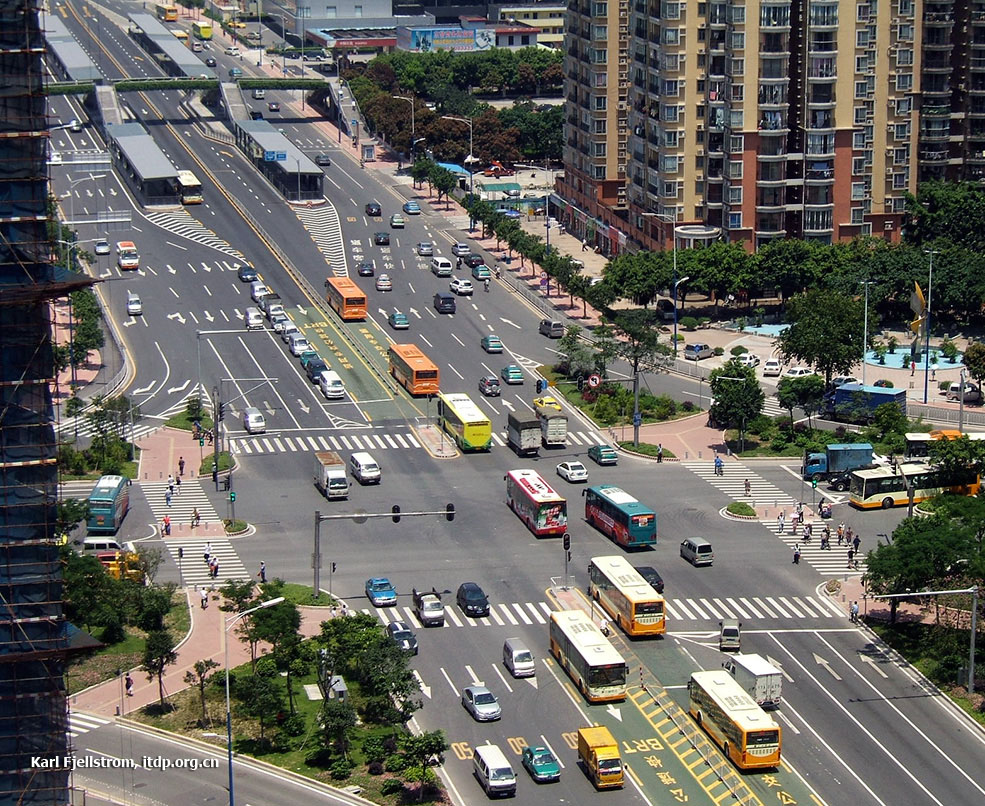
Intersections are critical to stations, as they represent an important point along any BRT corridor. A poorly designed intersection or a poorly timed signal phase can substantially reduce system capacity and speed, especially by hindering access to stations. Finding solutions to optimize intersection performance can do much to improve system efficiency. Generally, the three main objectives of intersection design along a BRT corridor are:
- To provide safe and convenient crossings for pedestrians;
- To minimize delay for BRT vehicles;
- To minimize delay for mixed traffic.
Travel times for walking trips are improved by following these objectives, but it should be noted that pedestrians’ safety and accessibility have the highest priority. Some methods take into account pedestrian times in order to analyze alternatives, and the approach discussed here does not equalize pedestrians by inputting delays into the process. Current procedures mostly try to fit demand needs into the available space so that pedestrians can make all crossings safely; bus lane queues are not so long that they block stations; and desired car movements are still possible, all without worsening congestion. Keep in mind that if public and private transport users’ times were equalized, every street with one vehicle carrying fifty passengers every two minutes would have an exclusive bus lane.
It is generally not advisable to use a standard intersection configuration throughout a BRT corridor. Rather, it is best to design the intersection for the specific conditions at the given location. The impact of a planned BRT system on overall intersection performance is often a significant consideration when deciding on a service plan for the BRT system, the location of the stations, and the design of the stations.
BRT system planners have used the following tools to rationalize intersections:
- Simplify the BRT system’s routing structure to optimize turning movements into the corridor;
- Optimize the number of intersections along the corridor;
- Restrict as many mixed-traffic turning movements on the BRT corridors as possible;
- Optimize the location of the station relative to adjacent intersections;
- Optimize the signal phasing and consider signal priority for public transport vehicles.
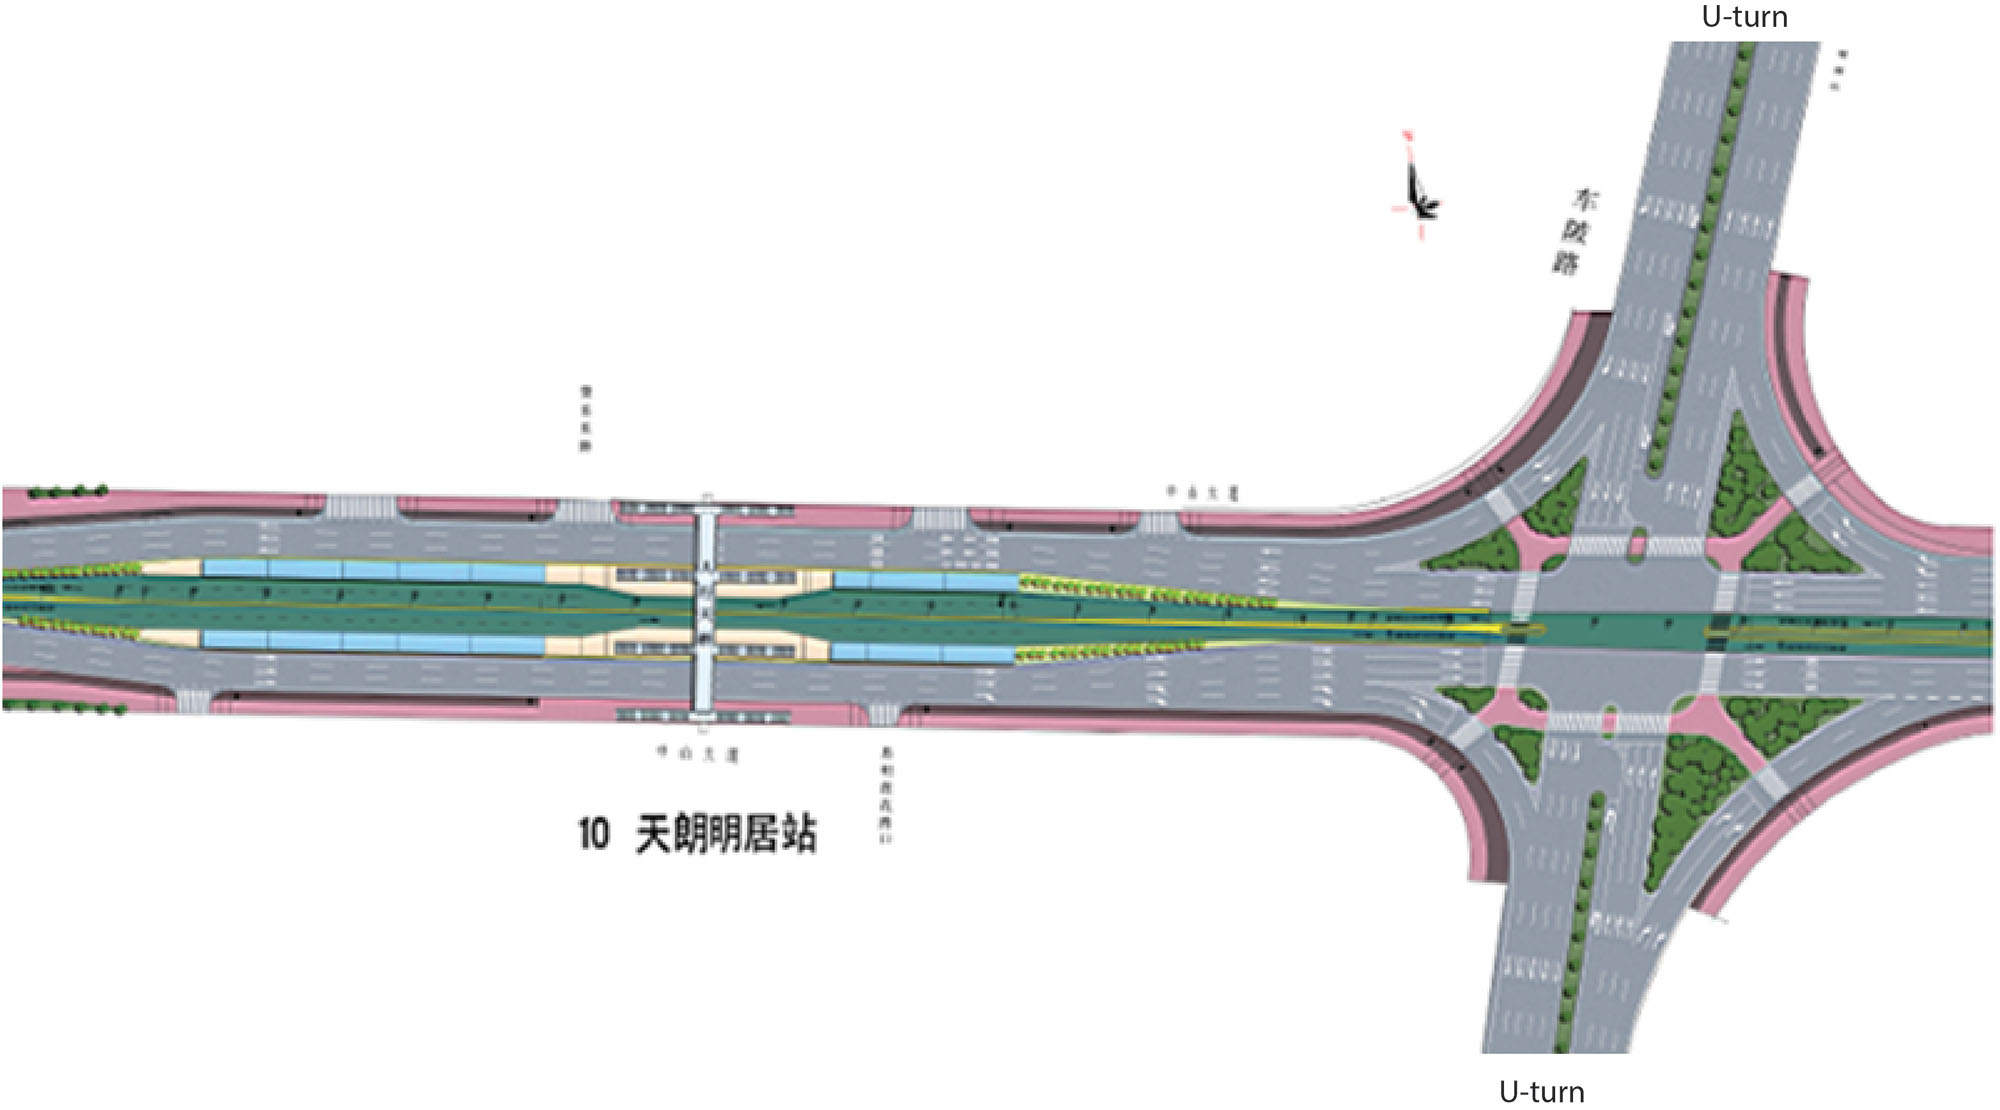
Every decision and solution proposed during the intersection design process should be technically supported by the elaboration of a comprehensive traffic study, where directional flow counts for cars and pedestrians are categorized and carried out at every active intersection (signalized or not) along the corridor being designed. This is necessary to diagnose the current performance of each intersection and forecast a future scenario incorporating the operational changes a BRT corridor might bring.
24.2.1Corridor Audits
As a first step to intersection design, BRT system planners should carefully review the existing mixed-traffic bottlenecks in the corridor. A small number of bottlenecks are often responsible for the vast majority of mixed-traffic delay. These bottlenecks are usually due to one or more of the following conditions:
- Narrow bridges and tunnels;
- Traffic convergence points;
- Poorly regulated/enforced parking;
- Suboptimal timing at traffic signals;
- Improperly designed and channeled intersections;
- Badly placed bus stops or unregulated stopping of public transport vehicles.
Quite often a new BRT system can lead to a reduction of the number of lanes available to mixed traffic. While ideally the removal of a large number of buses from the mixed-traffic lanes will avoid worsening congestion in the mixed-traffic lanes, this is not always possible, and the mixed-traffic saturation level may increase.
Figure 24.15 illustrates the vehicular demand saturation level along a planned BRT corridor and what could be expected if one lane is removed.
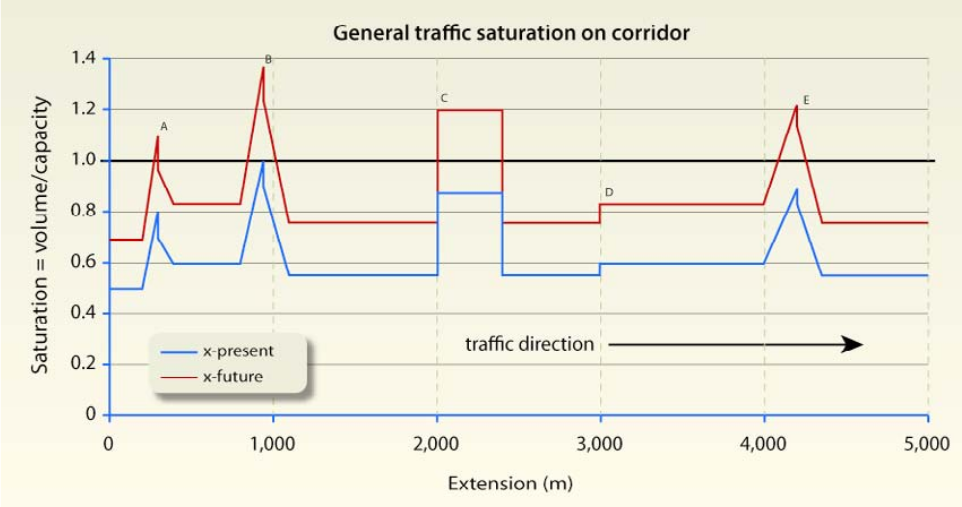
The most serious bottlenecks—points A, B, and E—are signalized intersections. Point C might be a bridge or tunnel where, for example, lanes are reduced from three to two, increasing saturation by 50 percent. Point D might be a popular destination such as a shopping mall where an extra volume of vehicles enters the road, increasing saturation. It might also be a popular bus interchange, a street market, or an area with regulated on-street parking.
If no measures are taken to mitigate the lane removal due to the BRT implementation, then congestion restricted to point B will occur at A, B, C, and E. These points now require more careful attention.
24.2.2Solution Approach
Once the basic routing structure of the new BRT system has been determined, system designers should have a reasonable idea about likely vehicle frequencies within the system.
Considering the placement of the BRT corridor and its requirements, the non-intersection bottlenecks should be addressed first. These problem points can generally be resolved through a combination of tightening parking regulation and enforcement, strengthening vendor regulation and enforcement, narrowing medians, improving parallel roads, or widening roads if all else fails.
The second analysis should determine if the busway will congest given the current intersection signal phasing and lane allocation along the BRT corridor. Each intersection in the corridor should be analyzed. An example of the intersection delay impacts calculation is given in the next section. Intersections that do not match the BRT requirements should be redesigned.
Once the implementation of the new BRT system requires changing the intersection design anyway, the opportunity should be taken to improve the overall efficiency of the intersection. Packaging these intersection improvements with the introduction of the new BRT system will help improve public acceptance of the new BRT system. The less efficient the intersection was before the BRT system, the greater the potential there will be to design the new system in a way that improves conditions for both public transport passengers and mixed traffic.
24.2.3Signal Delay on BRT
Table 24.2 shows an example of the variation in the average traffic signal delay for each BRT vehicle crossing an intersection as a function of the red and green signal duration within a defined cycle time.
Signal delay is given by Equation 24.15 and fixed parameters for the example are:
- Cycle time: Tcycle = 80 seconds;
- BRT vehicle frequency across the intersection: DemandFlow = 200 articulated-bus/hour;
- BRT lanes: NLanes = 1 lane;
- Discharge flow rate: saturationflowperlane = 720 articulated-bus/hour/lane.
Table 24.2- Signal delay as function of red light
| Red light time (seconds) | Green light time (seconds) | Average signal delay (TF) (seconds) | Random queuing delay (TQs) (seconds) | Total signal delay (TS) (seconds) | Demand to signal capacity level (XSignal) |
|---|---|---|---|---|---|
| 0 | 80 | 0.00 | 0.00 | 0.00 | 0.28 |
| 10 | 70 | 0.87 | 0.00 | 0.87 | 0.32 |
| 20 | 60 | 3.46 | 0.00 | 3.46 | 0.37 |
| 30 | 50 | 7.79 | 0.00 | 7.79 | 0.44 |
| 36 | 54 | 11.22 | 0.18 | 11.40 | 0.51 |
| 40 | 40 | 13.85 | 2.25 | 16.10 | 0.56 |
| 42 | 38 | 15.27 | 3.68 | 18.94 | 0.58 |
| 43 | 37 | 16.00 | 4.53 | 20.53 | 0.60 |
| 44 | 36 | 16.75 | 5.52 | 22.27 | 0.62 |
| 45 | 35 | 17.52 | 6.65 | 24.18 | 0.63 |
| 46 | 34 | 18.31 | 7.98 | 26.29 | 0.65 |
| 47 | 33 | 19.12 | 9.56 | 28.67 | 0.67 |
| 48 | 32 | 19.94 | 11.45 | 31.39 | 0.69 |
| 49 | 31 | 20.78 | 13.78 | 34.56 | 0.72 |
| 50 | 30 | 21.63 | 16.71 | 38.35 | 0.74 |
| 51 | 29 | 22.51 | 20.51 | 43.02 | 0.77 |
| 52 | 28 | 23.40 | 25.62 | 49.02 | 0.79 |
| 53 | 27 | 24.31 | 32.86 | 57.17 | 0.82 |
| 54 | 26 | 25.23 | 43.94 | 69.18 | 0.85 |
| 55 | 25 | 26.18 | 63.00 | 89.18 | 0.89 |
| 56 | 24 | 27.14 | 103.50 | 130.64 | 0.93 |
| 57 | 23 | 28.12 | 248.14 | 276.26 | 0.97 |
Thus, if there are 200 articulated buses per hour in a single lane, and there is an 80-second traffic signal cycle with a red phase of 35 seconds, then there is no difference between total signal delay and average signal delay. In this case there is no additional delay resulting from the randomness of vehicle queues at the stoplight. However, if there is more than 35 seconds of red time, the random queuing of buses at the traffic light begins to add additional delay.
In summary, intersection delay is largely a function of red time as a share of total signal time. If demand-to-signal capacity level is greater than 0.65, random delay becomes significant, and the project design should be changed to give a higher proportion of green time, and/or a second BRT lane on the approach to the intersection should be considered (Figure 24.16).