7.1Design Objectives
An optimist will tell you the glass is half-full; the pessimist, half-empty; and the engineer will tell you the glass is twice the size it needs to be.Anonymous
BRT projects seek to optimize one basic parameter: minimizing door-to-door travel time. Thus, to achieve that goal, BRT must be designed and planned—including corridor selection, routes and service plan, and alternatives—to ensure that:
- Capacity is sufficient to handle expected customer demand;
- Waiting and transfer times are reduced by providing frequent service;
- Speeds are high, because of reduced delay at stations; ideally, average speeds should be above 20 kph in areas with frequent intersections, 25 kph where there is little mixed traffic interference, and above 40 kph for limited-stop services.
The reduction of waiting/transfer times should have been addressed with service planning. The focus of this chapter is how to achieve sufficient capacity and high speeds. As the number of vehicles and customers increases, the opportunity for bottlenecks and operational problems multiplies. Busway systems can be designed to operate at high capacities, but in some cases, high-demand designs have also produced relatively slow commercial speeds. For example, prior to the Bogotá TransMilenio system, the busway on the Avenida Caracas corridor was able to move more than 30,000 passengers per hour per direction (pphpd); this is less than the current BRT system in the same corridor, but it still exhibits a very high demand. However, due to significant congestion, the vehicles only averaged 10 kph. By comparison, the TransMilenio BRT system operates at an average commercial speed of approximately 27 kph.
Assuming that congestion in mixed traffic is ruled out with the creation of a busway, two obvious candidates can cause delay in the BRT system: intersections and stations. Unless there is conflict between station and intersection design, one should assume that, at intersections, buses would experience a delay similar to cars. One can expect that the delay experienced by the BRT at intersections is similar to cars in off-peak hours and that BRT will perform better than cars at rush hour. Chapter 24: Intersections and Traffic Signals addresses station location in relation to intersection design, reviews station delays associated with intersections, and suggests how to improve BRT and car travel times at intersections. If stations are properly designed, they are far more likely to increase BRT speeds. If not properly designed, however, stations may contribute to decreased speeds, as well as decreased capacity in relation to a conventional system.
The demand analysis process and demand forecast modelling can help quantify existing public transport demand, as well as provide projections of expected demand and growth. A system’s infrastructure should be designed for capacities projected at least one decade into the future. The size of the growth cushion will depend on how fast a city’s population and mobility needs are increasing. For example, in some rapidly urbanizing Chinese cities, growth rates of up to 25 percent are being realized in fewer than five years. In such instances, a growth cushion of 50 percent or higher may be appropriate for sizing the system’s capacity. In other regions that are already highly urbanized, such as Latin America, growth rates are much lower. In Latin American cities, a growth cushion of 25 percent has been used.
Designing a high-capacity and high-speed BRT system does not guarantee that door-to-door travel times will be minimized. High-capacity and high-speed services can be achieved simply by eliminating all the stops along a BRT corridor, and having service run only between the two terminals. Metro systems are often designed with very long distances between station stops in order to increase average speeds and capacity. However, this has an adverse impact on door-to-door travel times, as customers will have much farther to walk to reach the nearest public transport station. The system’s design therefore must be optimized so as to minimize door-to-door travel times for the majority of customers—not just in terms of speed and capacity.
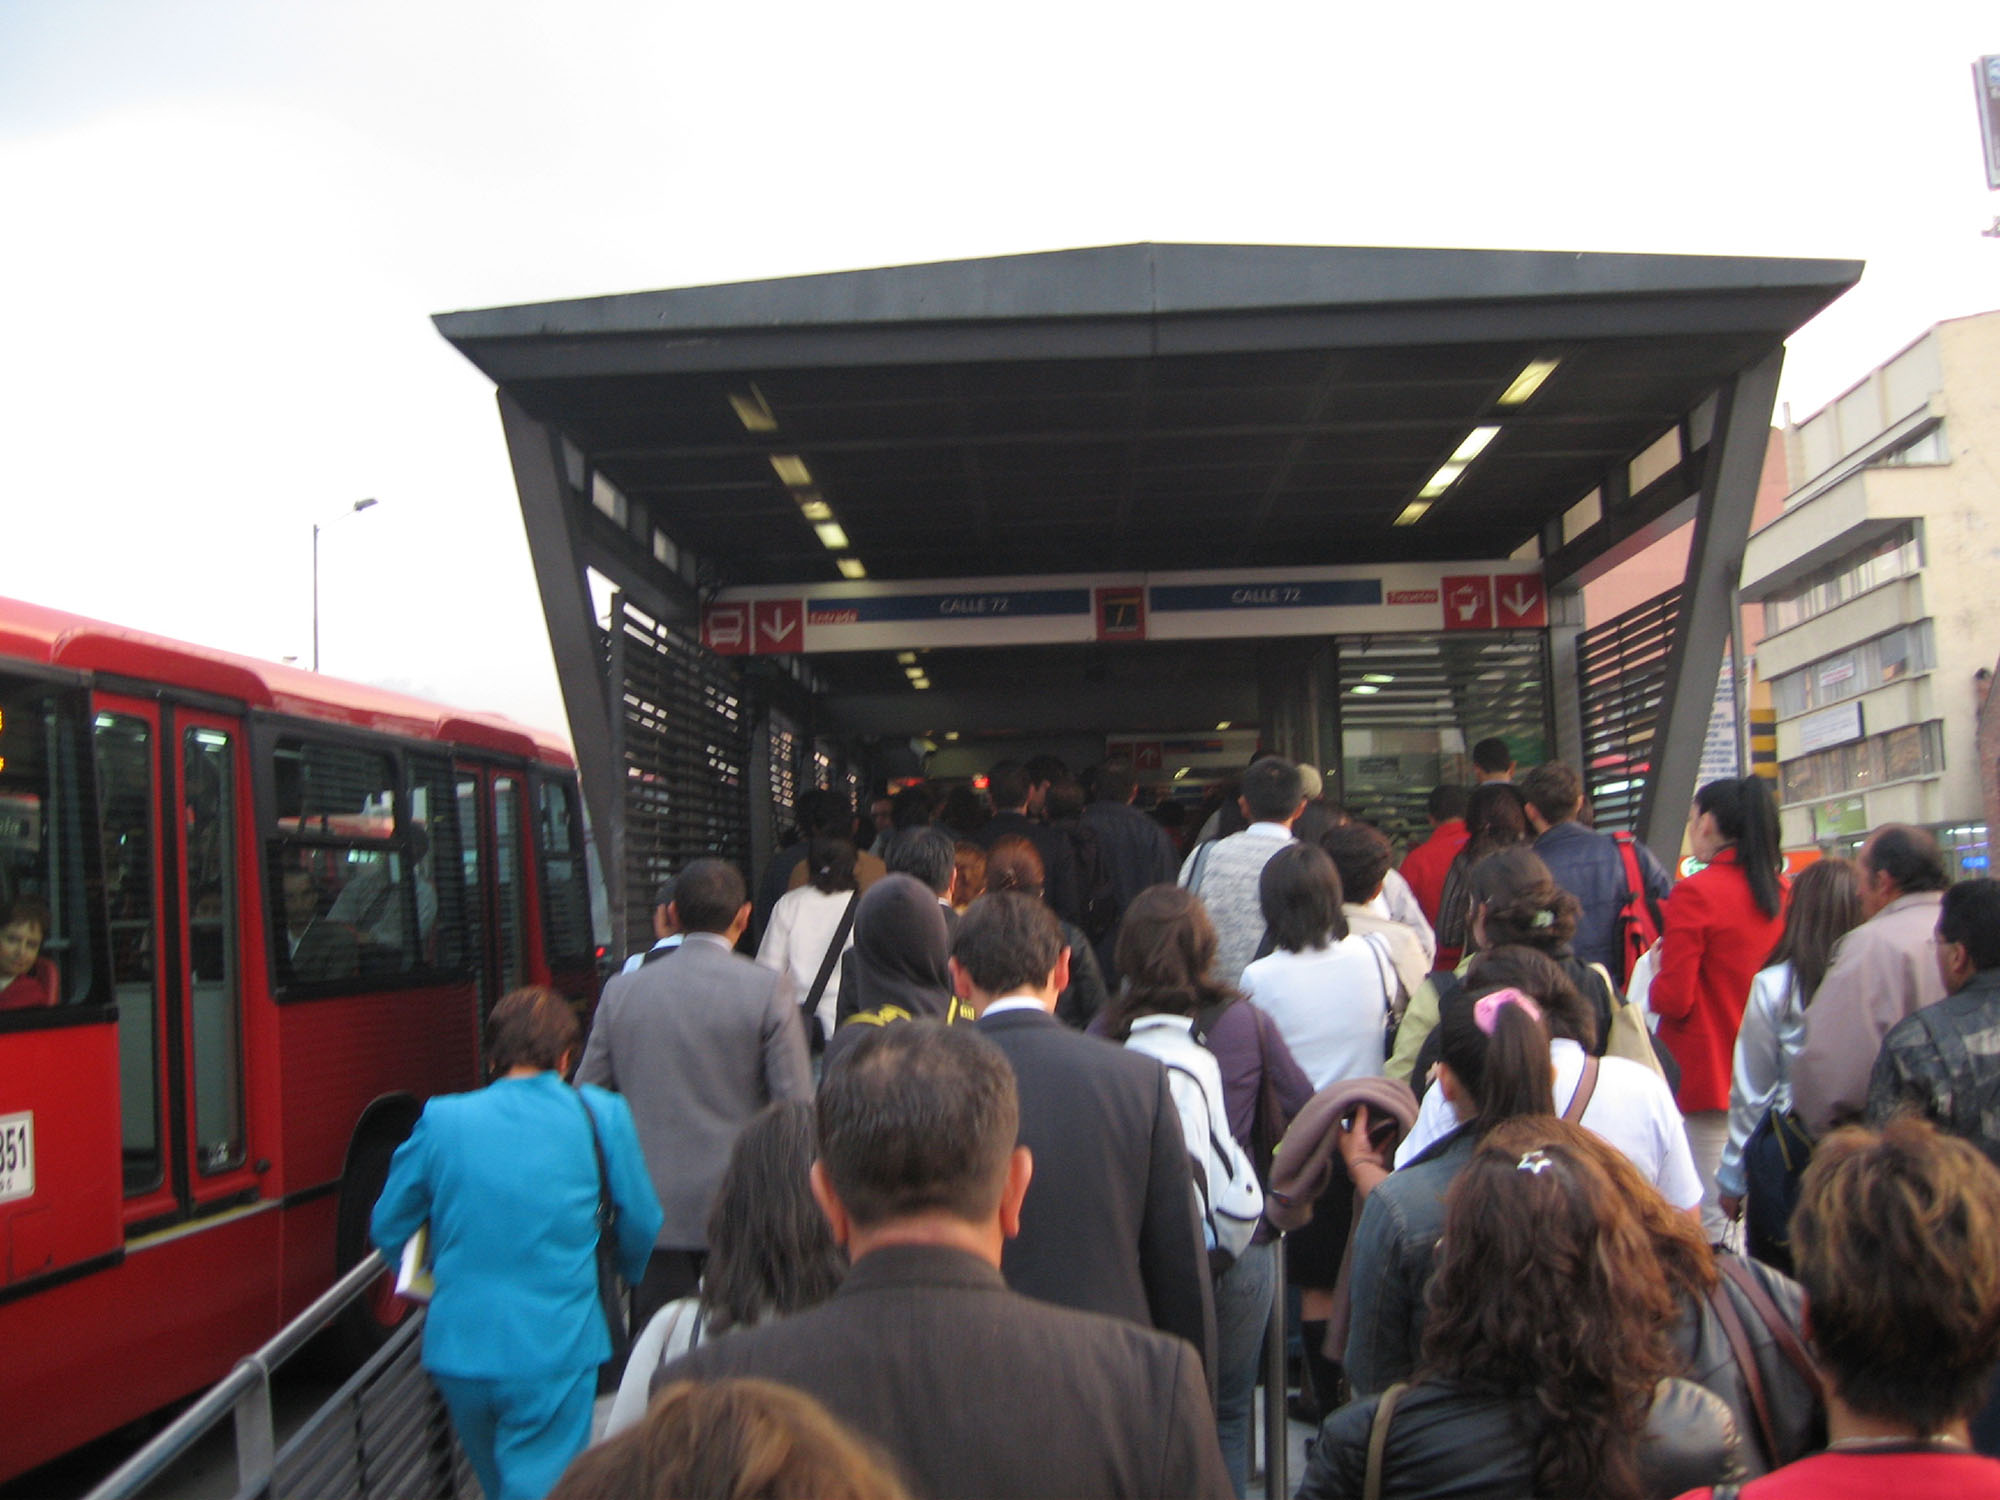
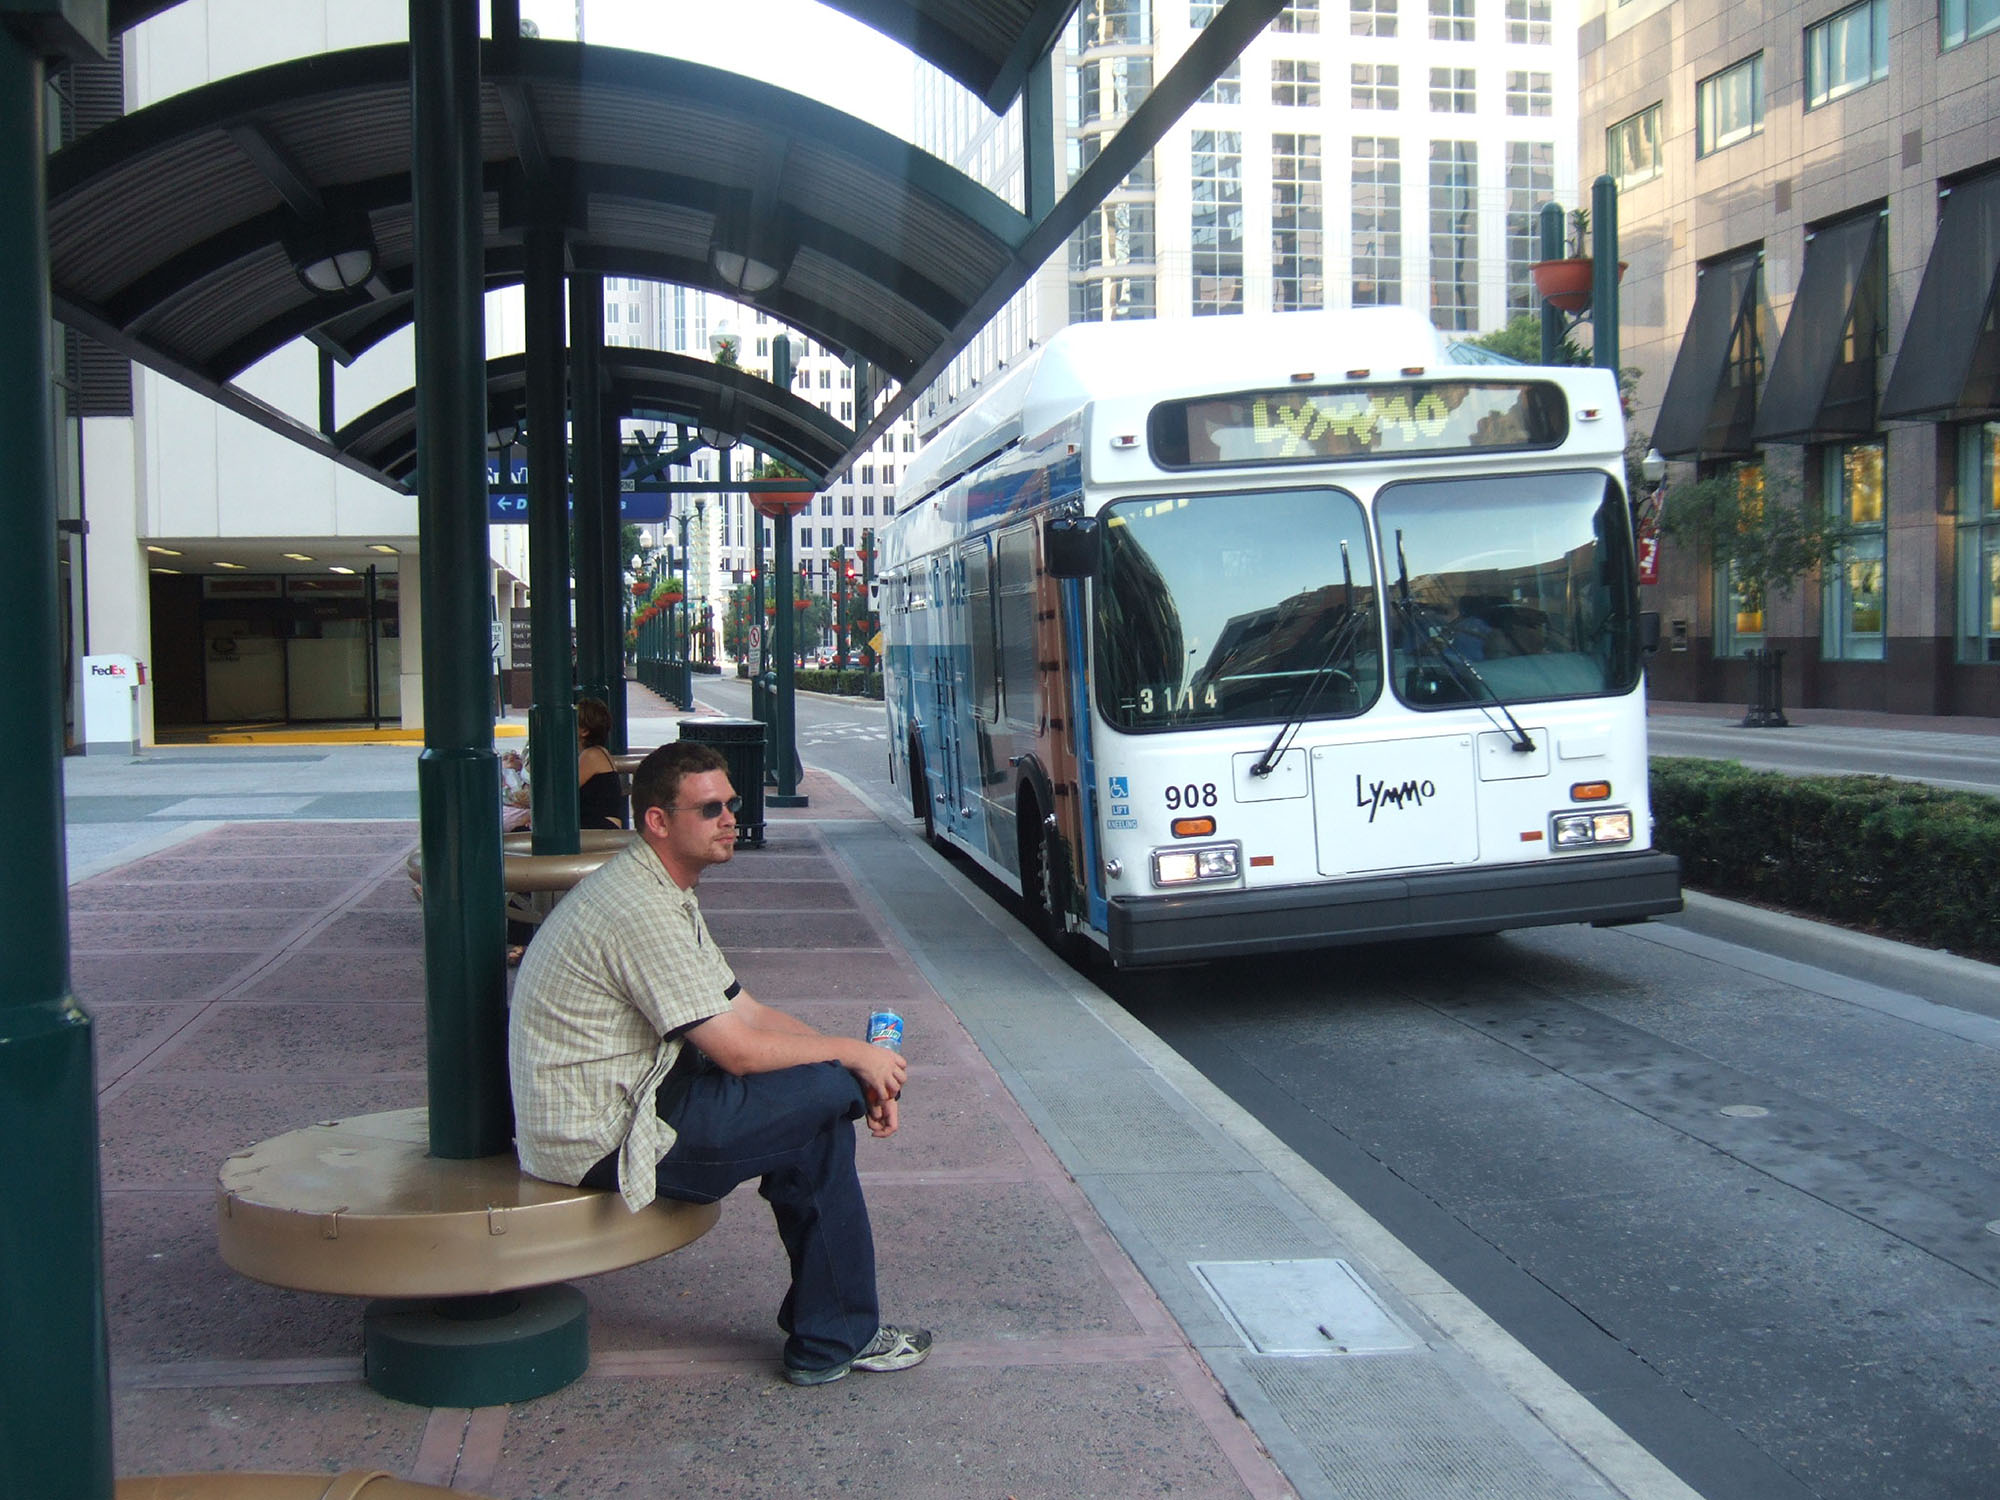
The specific design solutions to achieve high capacity vary widely for different levels of demand. For example, a BRT system that only needs to handle a demand of 5,000 passengers per hour per direction (pphpd) will be significantly different from a system requiring over 30,000 pphpd (Figures 7.1 and 7.2).