7.5Expanding Corridor Capacity
Good design begins with honesty, asks tough questions, comes from collaboration and from trusting your intuition.Freeman Thomas, designer, 1957–
Various design modifications in BRT services and infrastructure expand the capacity of a BRT system. The goal of these modifications is to carry more customers—while minimizing the saturation level at stations—and thereby ensuring good service speeds.
7.5.1Increasing the Service Frequency
The service frequency refers to the number of vehicles per hour. The waiting time between vehicles, which is roughly the same idea, is known as the headway. Up to a point, simply increasing the vehicle frequency on a BRT corridor can increase the corridor capacity. However, at frequencies of more than sixty vehicles per hour, simple BRT corridors with one lane per direction tend to experience an unacceptably high level of vehicle bunching, or saturation. Therefore, the designer must turn to other alternatives, as discussed in the sections below.
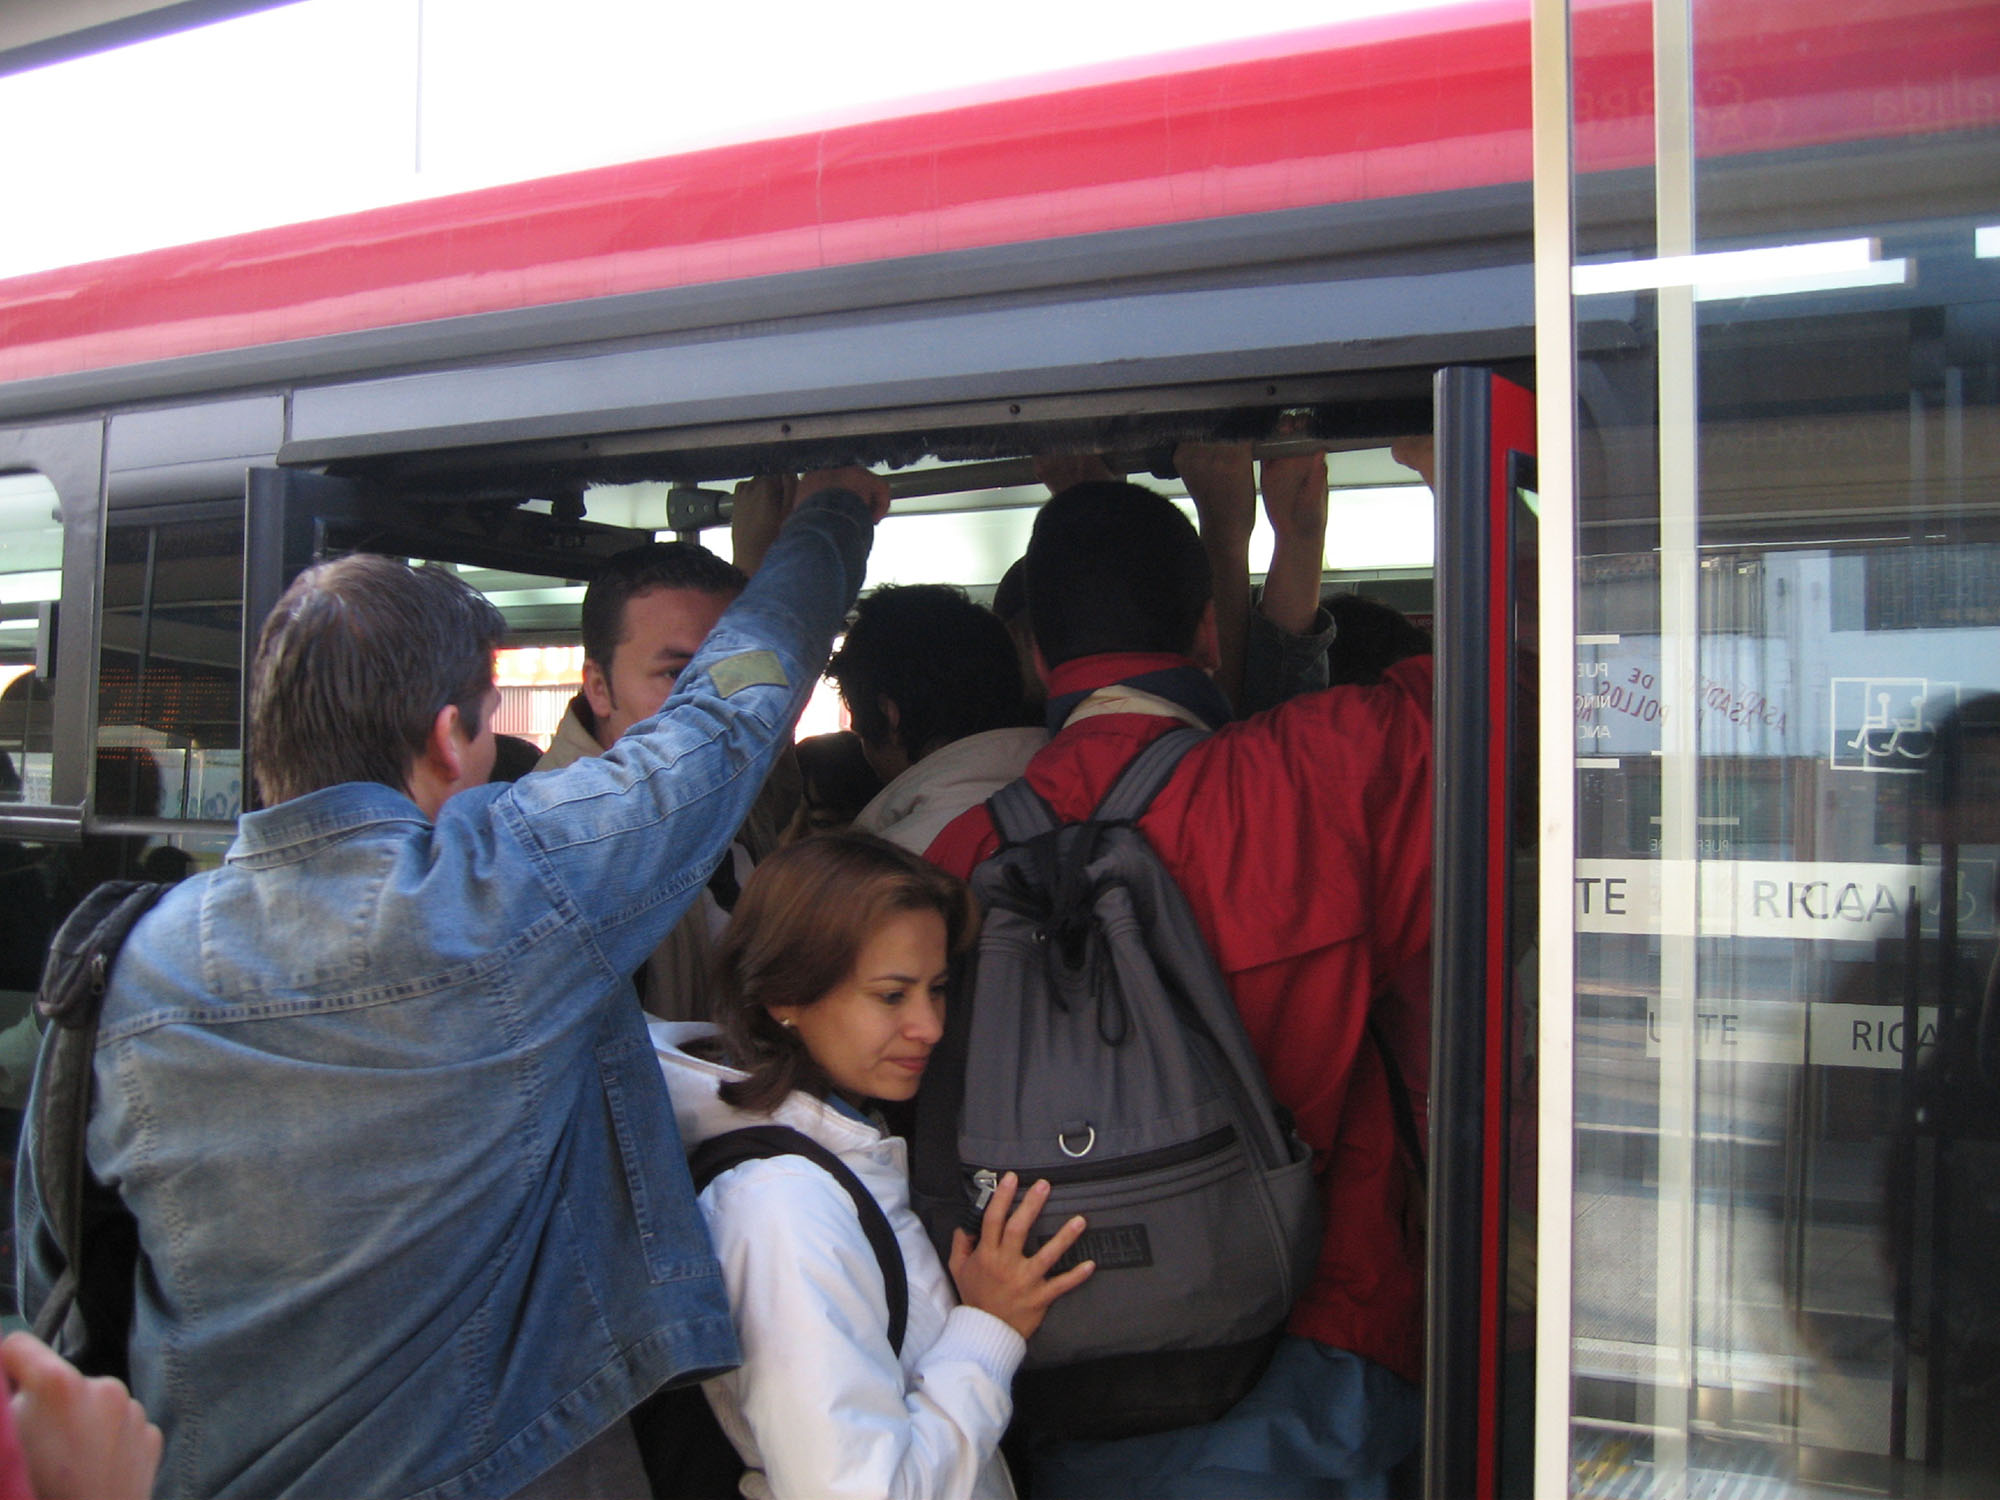
The desired load factor may vary between peak and nonpeak periods. In Bogotá’s TransMilenio system, typical load factors are 80 percent for peak periods and 70 percent for nonpeak periods. But as ridership levels grow in Bogotá, overcrowding becomes an increasing concern (Figure 7.9).
7.5.2Using Larger Vehicles
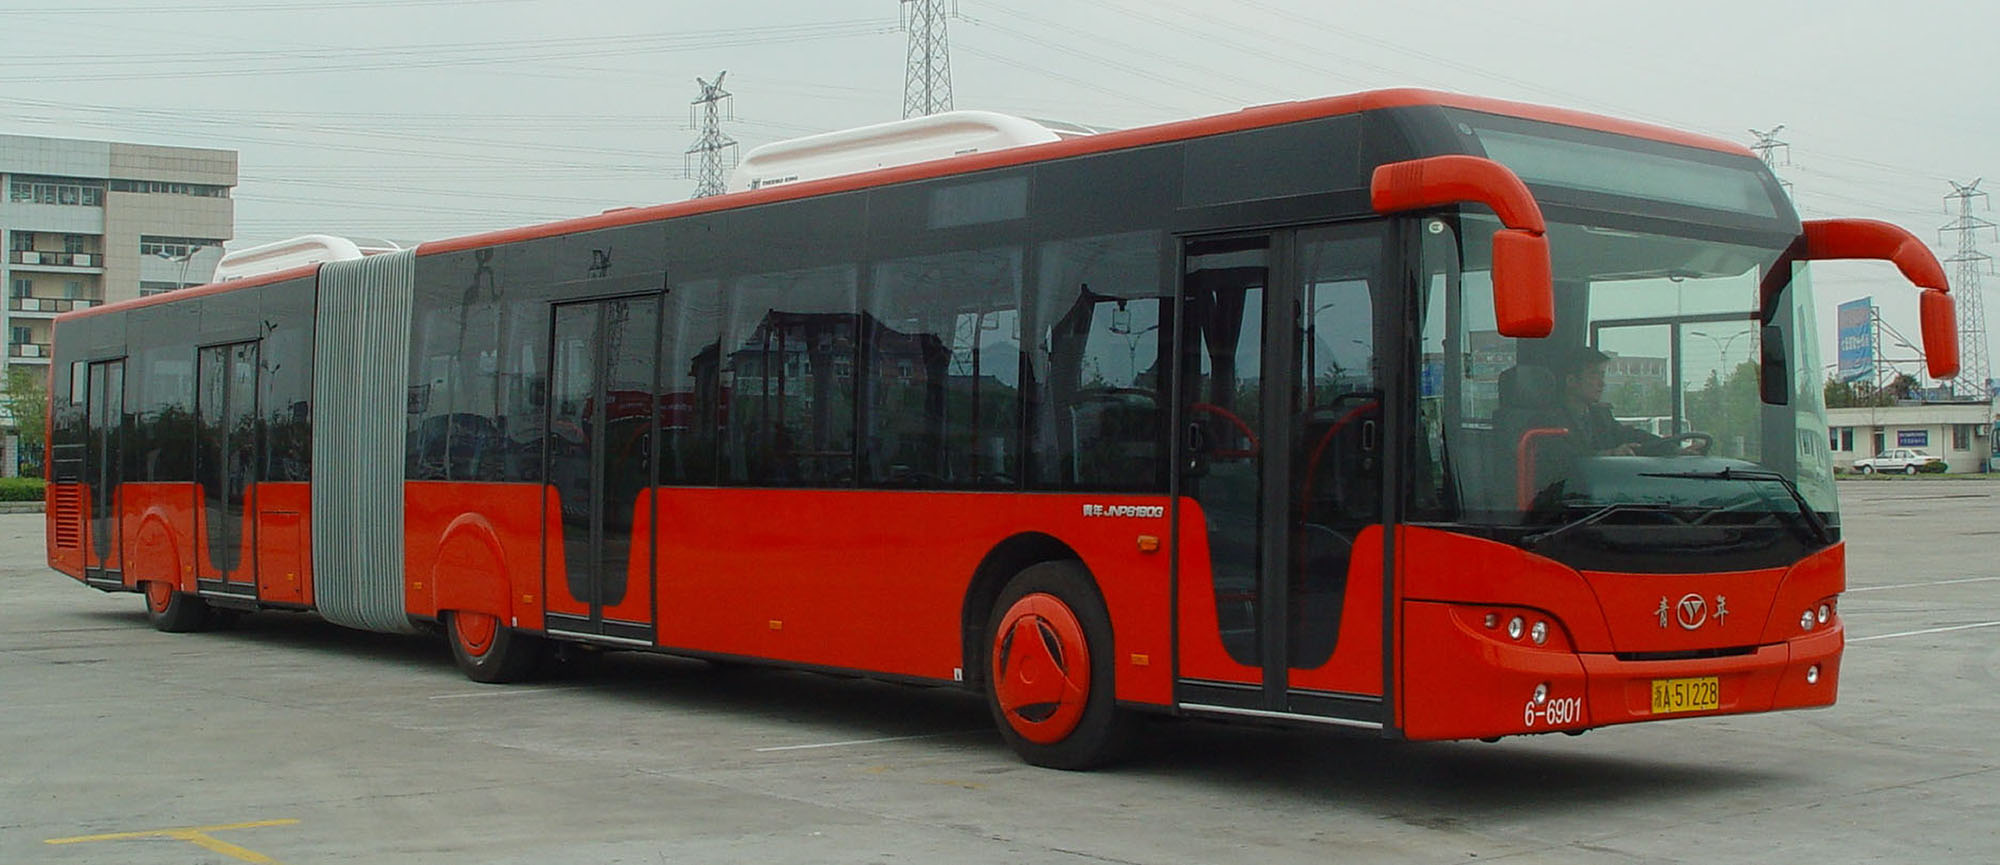
If a corridor is liable to reach saturation by way of the number of vehicles per hour, one solution is to increase the size of the vehicles. Replacing regular 12-meter vehicles with articulated 18-meter vehicles results in a dramatic increase in capacity—without causing a significant worsening in the saturation level. Determining the vehicle size should take into account the costs of vehicle operations against waiting times, as discussed in Section 6.4: Optimizing Vehicle Size and Fleet Size. Stations and service plan alternatives should adapt to use the optimal size to the required demand.
As has been noted, system designers have many vehicle size options. Table 7.12 summarizes the standard vehicle sizes available to system developers. Higher vehicle capacity can, in the right circumstances, increase BRT system capacity, but the right vehicle size is not always the largest vehicle. The main advantage of larger vehicles stems from reductions in operating costs, especially driver labor costs per customer carried. However, in lower-demand corridors, these large vehicles also tend to mean lower frequency, and hence longer waiting times for customers.
Table 7.12Trunk Corridor Vehicle Options
| Vehicle type | Vehicle length (meters) | Capacity (customers per vehicle) |
|---|---|---|
| Bi-articulated | 24 | 240–270 |
| Articulated | 18 | 120–170 |
| Elongated | 15 | 90–120 |
| Standard | 12 | 60–80 |
| Minibus | 6 | 25–35 |
Increasingly, the 18-meter articulated vehicle is becoming the standard for BRT systems. The Curitiba system has utilized the larger bi-articulated vehicles, as have Mexico City’s Insurgentes Avenue and TransMilenio in Bogotá. There are several reasons for the current dominance of the articulated vehicles (160-customer capacity) over the bi-articulated vehicle (270-customer vehicle):
- Large numbers of articulated vehicle orders have produced cost savings through economies-of-scale in manufacturing;
- Currently only a few manufacturers offer a bi-articulated vehicle, thus limiting the power of competition during the bid process;
- Heavier weight of bi-articulated vehicles reduces fuel efficiency and ability to accelerate rapidly;
- Length of bi-articulated vehicles (24 meters) can create difficulties with regard to available length of right-of-way at stations.
There may be instances where the operational and physical characteristics of a corridor would make a bi-articulated vehicle an appropriate choice. Chapter 20: Vehicles discusses vehicle technology options.
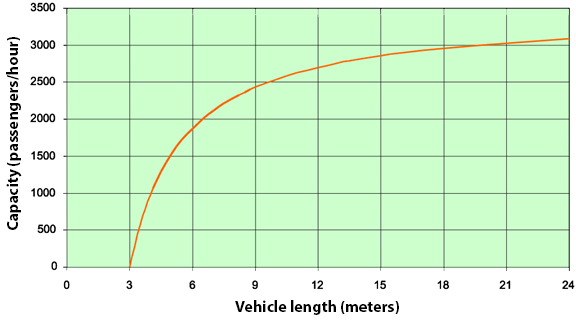
As vehicle length increases, there can be a diminishing return in terms of delivered capacity. If sub-stop capacity is reached and vehicle congestion occurs, then the additional capacity may not be fully realized. Figure 7.11 gives an example of this effect for a given set of parameters.
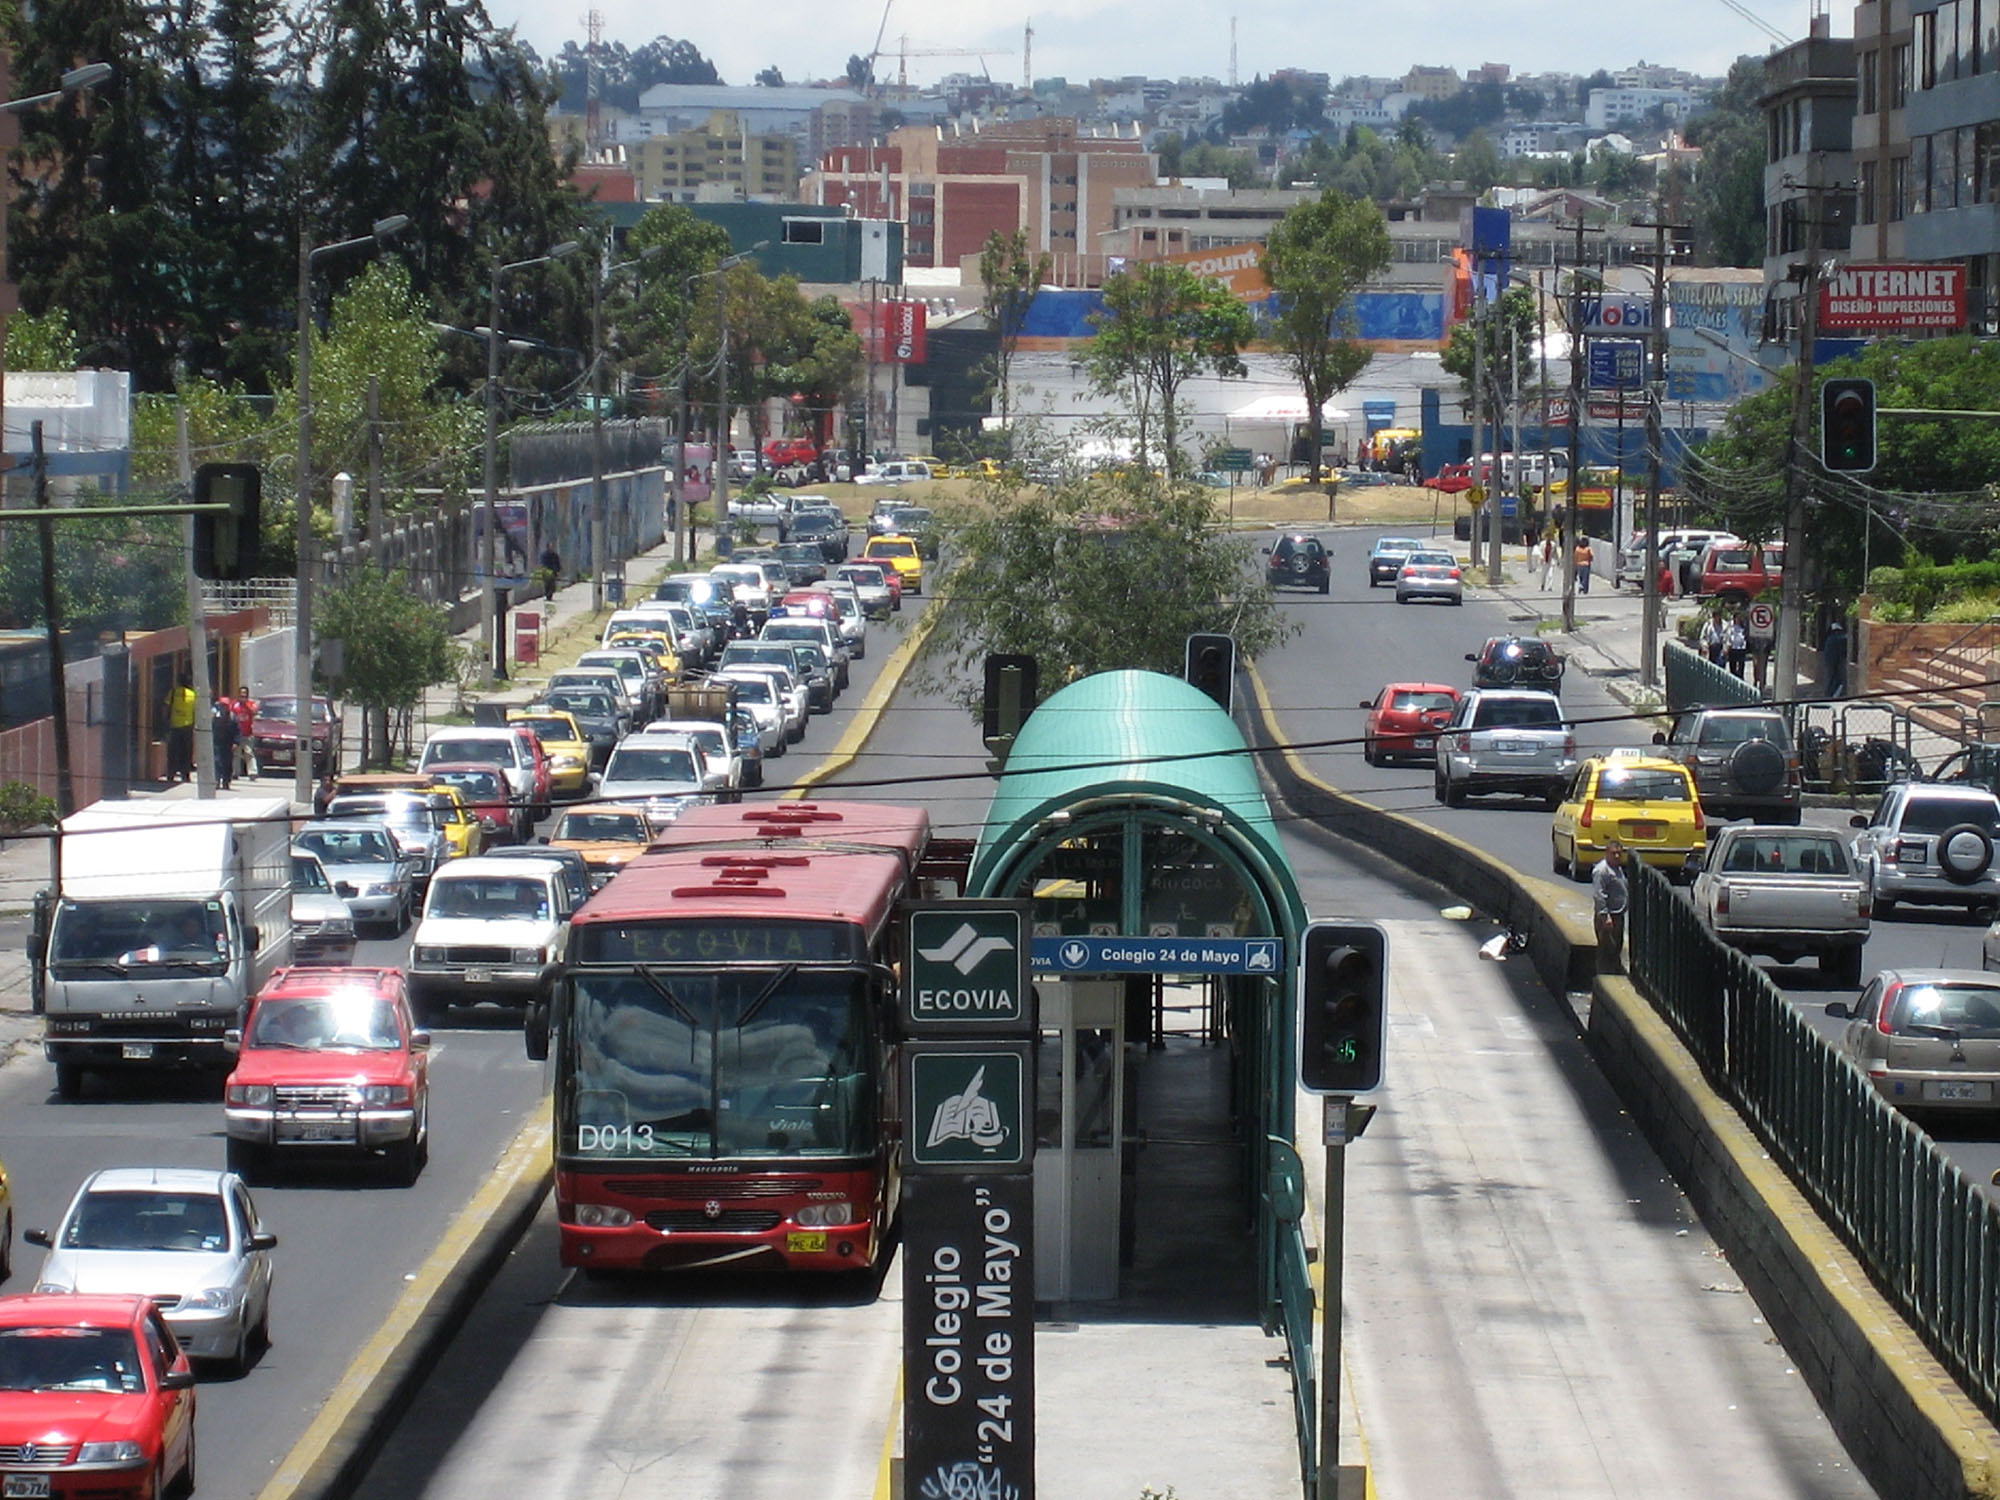
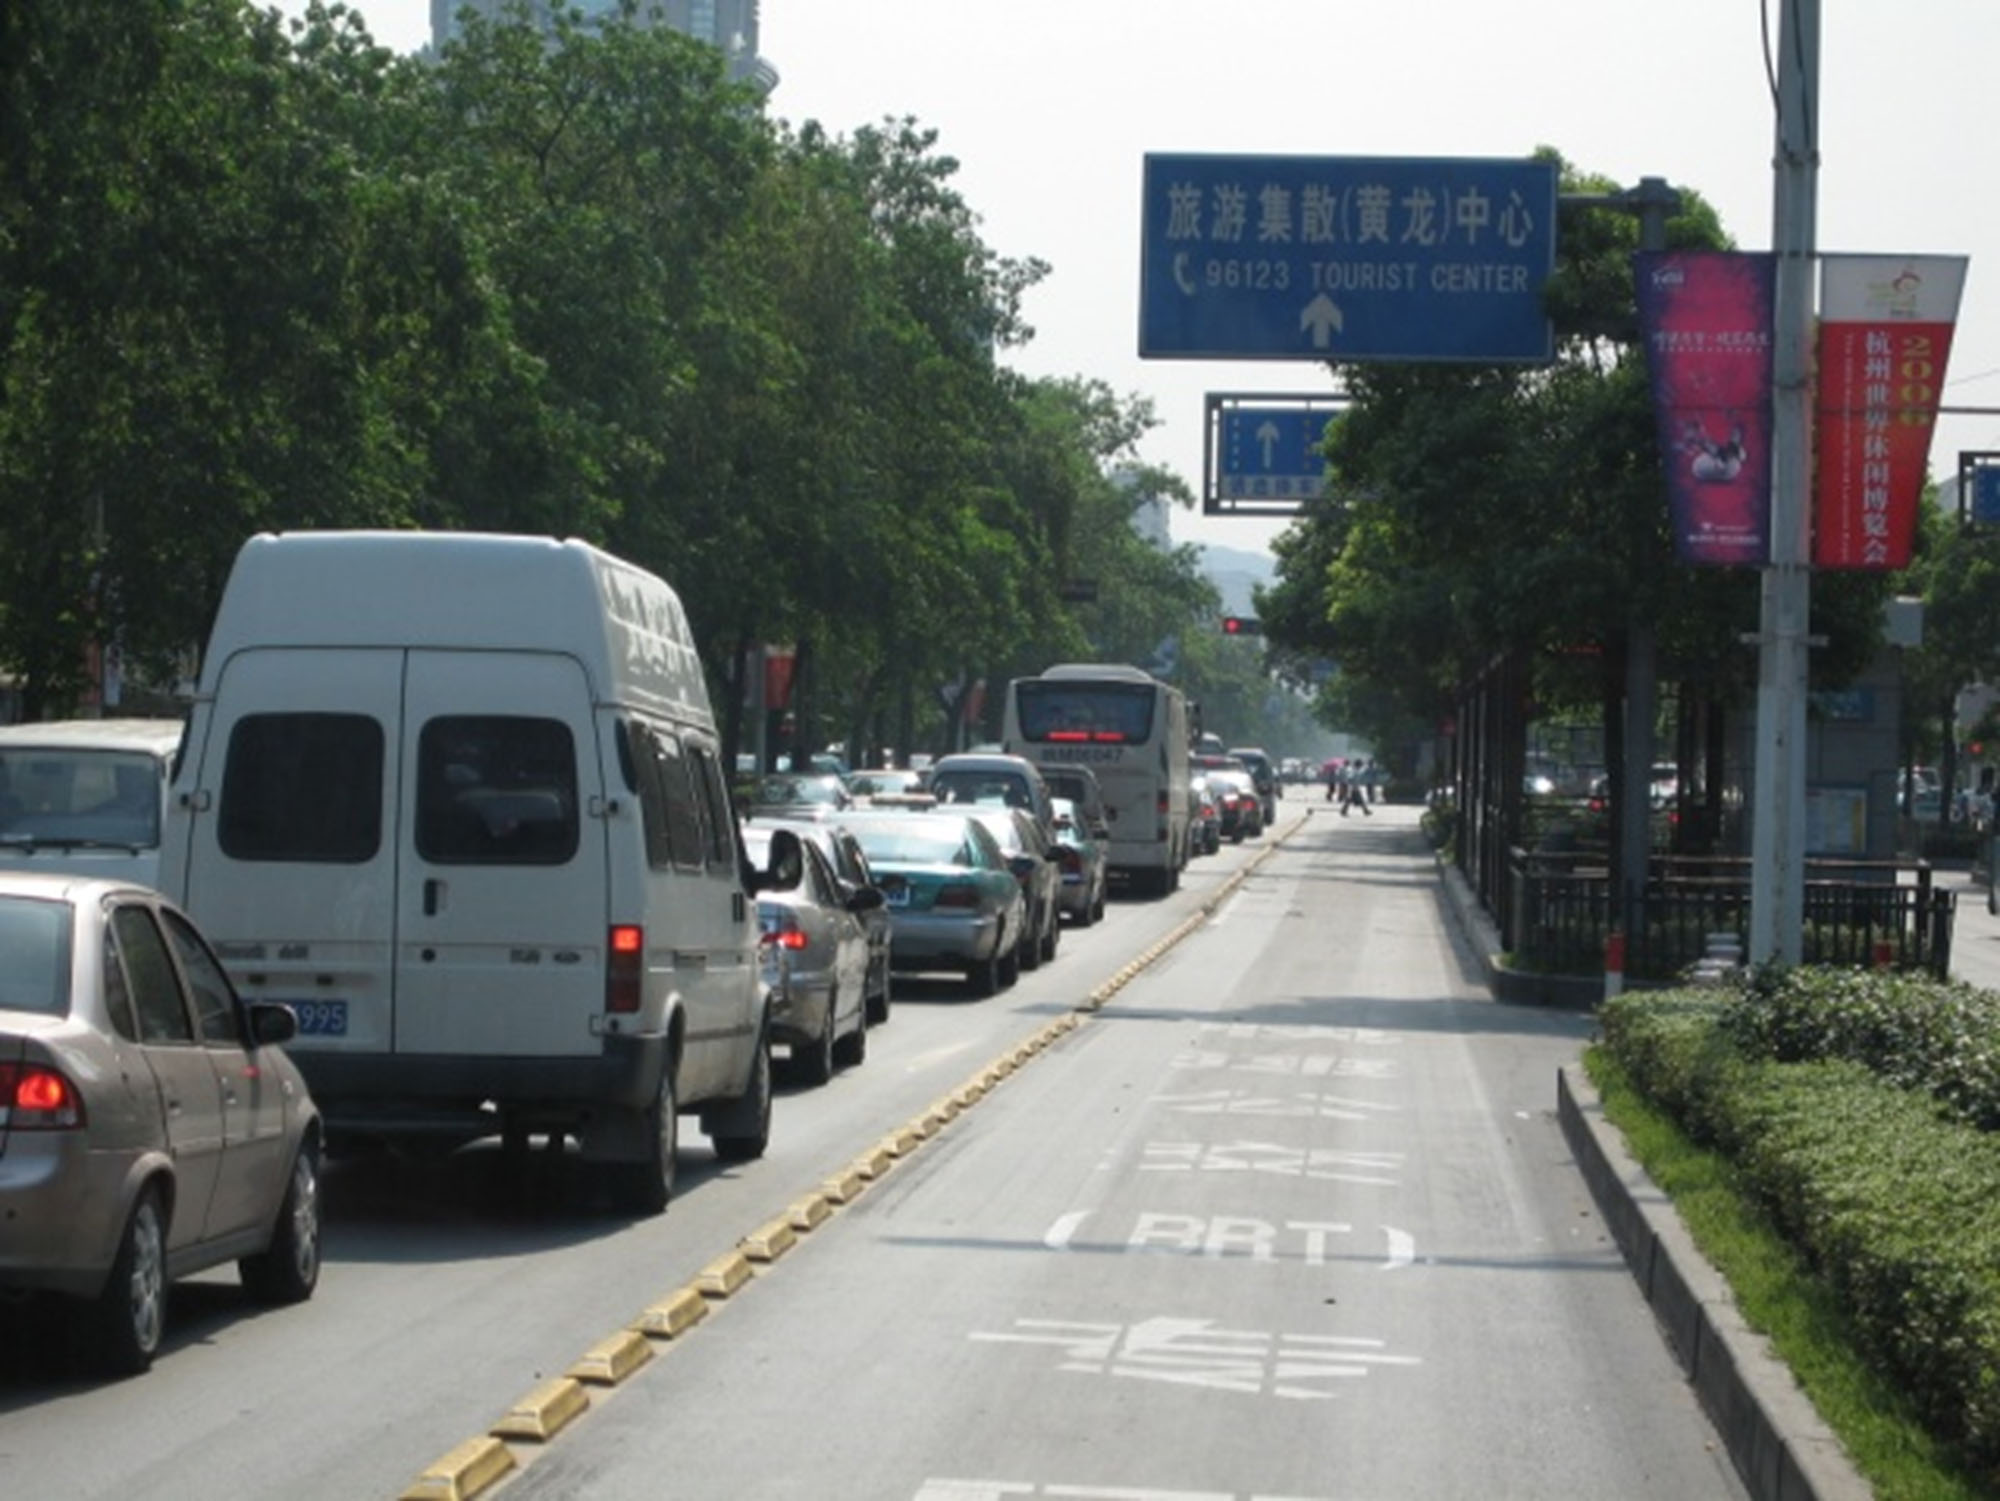
While the vehicle size may optimize costs, very low frequencies can have a perverse effect. First, customer frequency translates into reliability, and this is one of the main drivers of transit use. Without sufficient frequency and reliability, customers may choose other options, and the system will lose ridership. Secondly, car drivers in traffic congestion will become frustrated from seeing an empty busway beside them. In turn, motorists will complain that the road is being under-utilized (Figures 7.12 and 7.13). Such complaints ultimately undermine political support for future busways. While a headway of a few minutes may not seem like a lot of time, a busway with a vehicle passing only every few minutes can appear to be empty most of the time. In Quito, pressure from motorist organizations led the national police to open up exclusive busway corridors to mixed traffic for a period of time in 2006. This conversion occurred despite the fact that each busway lane was moving three to four times the volume of customers as a mixed-traffic lane. Nevertheless, the perception of an empty busway next to heavily congested mixed-traffic lanes can create political difficulties.
7.5.3Adding Passing Lanes and Multiple Sub-Stops
Measures such as vehicle size, vehicle-station interface, and doorway widths all contribute to higher-capacity and higher-speed systems. However, even together, these measures will likely only produce capacities around 9,000 pphpd. Thus, while systems such as those in Curitiba and Quito are high-quality BRT systems, their maximum corridor capacities are limited to this value.
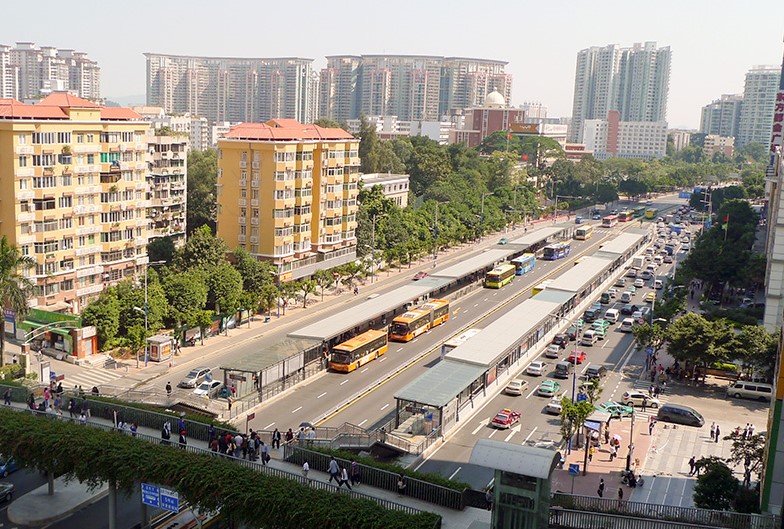
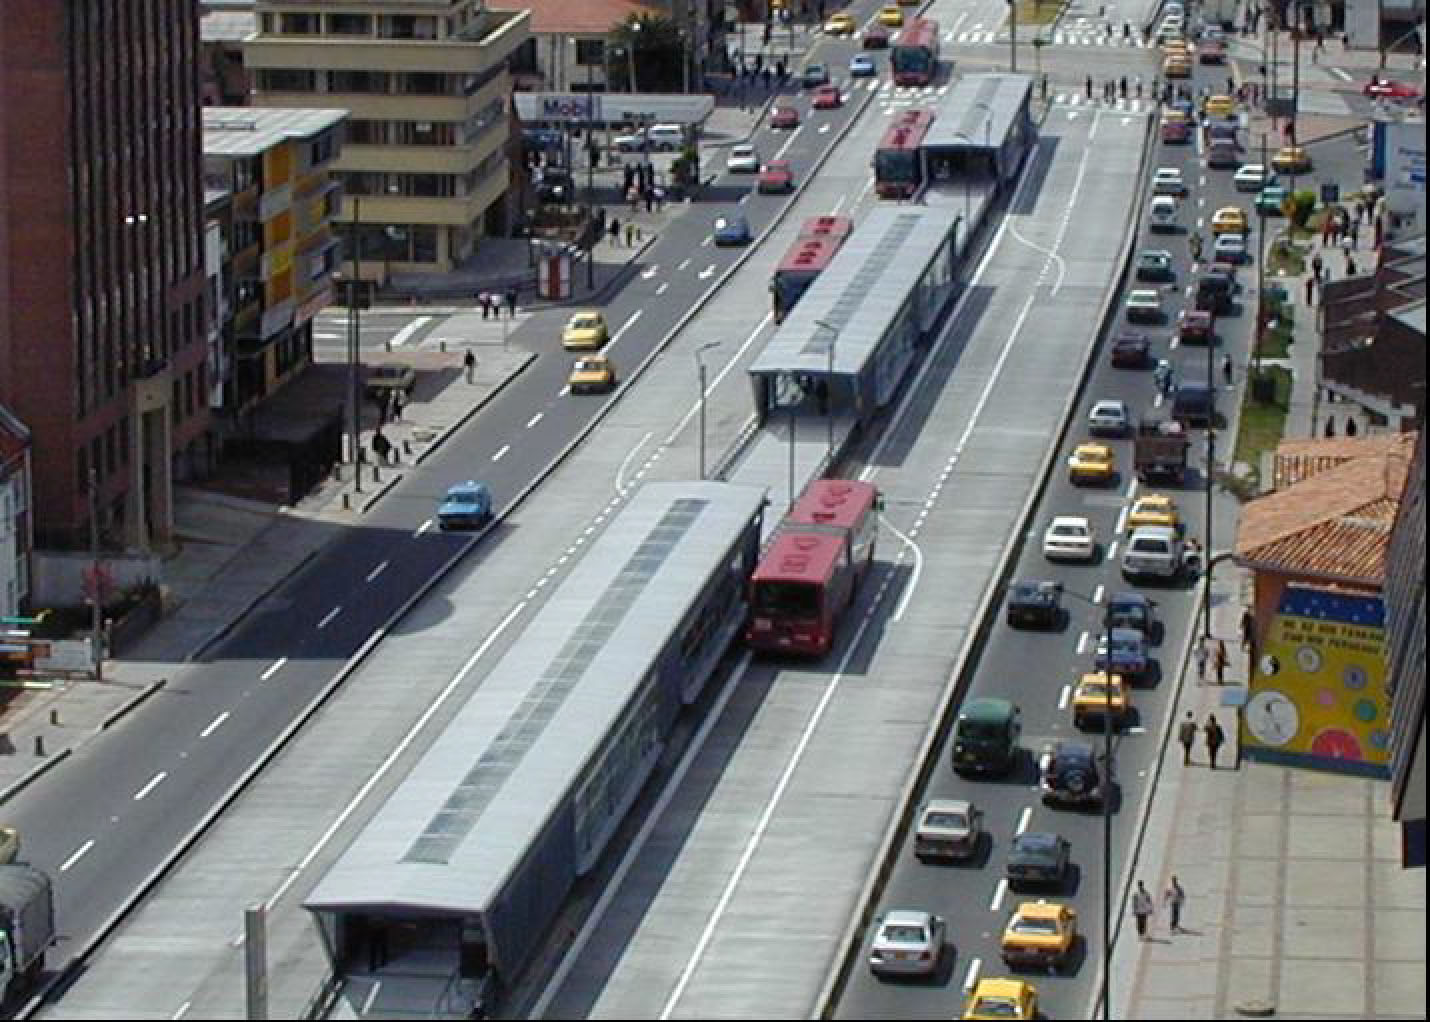
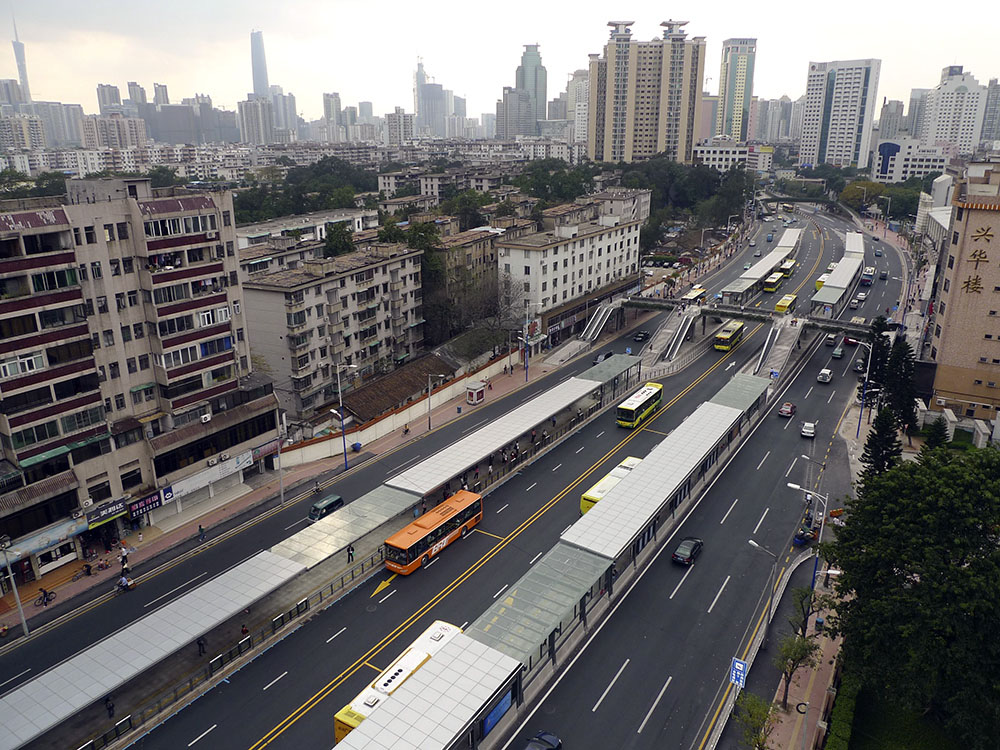
A key innovation of Bogotá’s TransMilenio system was that more capacity and speed was obtained because at each station, instead of having just one sub-stop, there were multiple sub-stops (Figure 7.14). In some cases, a single TransMilenio station will host up to three sub-stops (Figure 7.15). Each sub-stop represents a different set of services or routes (e.g., local services versus limited-stop services or routes with a different final destination). As a result, TransMilenio is able to handle capacities up to 45,000 pphpd, and there are good indications that values as high as 50,000 pphpd or even higher are now possible with BRT. Guangzhou achieves throughput of 27,400 pphpd, and new systems under construction in Rio de Janeiro promise to achieve even higher throughput levels than Bogotá and Guangzhou.
At any given point on TransMilenio’s corridors a vehicle passes every twenty seconds—a headway that would lead to significant saturation on a corridor without passing lanes. However, with passing lanes and multiple sub-stops and docking bays, the headway at each docking bay tends to be around one minute. Guangzhou similarly achieves very high frequency, and is, with Bogotá, the highest vehicle frequency BRT in the world, averaging around one vehicle every eleven seconds in the peak direction and peak hour. The Brisbane Busway achieves peak-hour vehicle frequencies of one vehicle every fourteen seconds in a single direction.
The presence of multiple sub-stops serves two distinct purposes. First, the multiple sub-stops permit many different types of services to operate from the same station, such as local services or limited-stop services. Each sub-stop represents a different set of services or routes. Second, the multiple sub-stops can dramatically reduce the saturation level at the stations. Since station saturation is typically the principal barrier to higher-capacity services, adding sub-stops is perhaps the cornerstone of any proposed system requiring higher capacity levels.
As noted earlier, to maintain a high level of service, saturation levels should be 40 percent or below. If saturation is over that, a second lane and a second sub-stop are likely to be required. As saturation increases, more sub-stops will be needed. In order to maintain a saturation factor of less than 0.40, services at each sub-stop must be properly scheduled and spaced to limit congestion. A saturation factor of 0.40 corresponds to approximately 60 vehicles per hour, but the specific sub-stop demand can reduce or increase this value. If 18-meter articulated vehicles are utilized, then 60 vehicles per hour corresponds to an approximate capacity of 9,000 pphpd, and this figure is a general limit for a simple one-lane operation. Since a lane will begin to congest once seventy vehicles per hour per direction is reached, a second sub-stop is recommended whenever volumes exceed this level.
Inclusion of Limited-Stop Services
With the inclusion of overtaking lanes, to increase capacity further, limited-stop services are likely to be the most relevant tool for planners. These services do not add to station saturation. In addition, they have higher commercial speeds. This way, stations with the highest demands can have services go directly to them. The potential of “express services” is limited for practical purposes, as the higher the demand, the easier it is to provide limited-stop services. One lane can serve up to 720 articulated-vehicles per hour. If 50 percent of this is used, that would be equivalent to more than 50,000 pphpd. Section 6.7.2 discusses how to implement direct service patterns. In the case of TransMilenio, approximately 50 percent of vehicles serve these types of routes.
Passing Lanes at Stations Only
The principal difficulty in including a passing lane is the impact on road space. Unless the corridor is highly saturated, passing lanes are usually not required beyond the stations. However, at station locations, the BRT system will occupy the width of the station plus two lanes in either direction, an approximate total of five lane widths for a station that serves both directions or a total of three lanes if the sub-stops for each direction are offset from each other. As discussed in Chapter 24: Intersections and Signal Control, if the BRT is in a section with intersections, narrowing mixed-traffic lanes will have no impact on the segment capacity if the station is at an appropriate distance from the intersections.
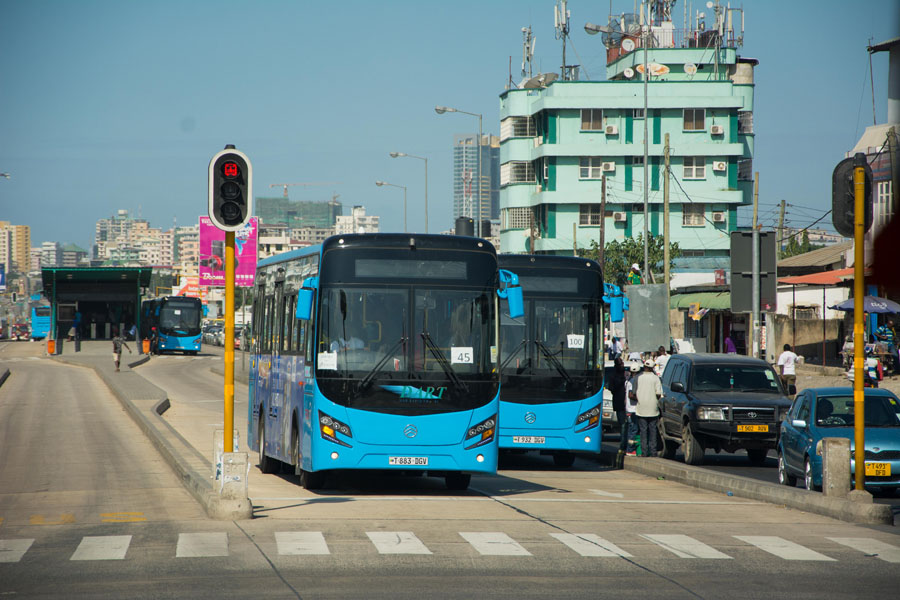
Other options for accommodating passing lanes in express roadways include making property purchases for widening. In some BRT cities, such as Barranquilla, Colombia, plans called for the purchase of properties near station areas. The road infrastructure was widened in these areas in order to accommodate the passing lane. This same strategy has been employed at some stations in the BRT system in Dar es Salaam, Tanzania, as shown in Figure 7.17. The viability of property purchases for this purpose depends on local property costs, as well as the existence of a well-designed compensation program for property owners.
7.5.4Convoying
In general, multiple sub-stops are coupled with passing lanes in order to allow vehicles to pass one another and thus readily access the appropriate docking bay. However, if there is insufficient space for passing lanes, there is still a way to utilize multiple sub-stops without a passing lane. Some of the benefits of separate sub-stops can be achieved through the “convoying” or “platooning” of vehicles. Convoys involve two or more vehicles operating along the busway in a closely bunched pack. In some respects, a convoy system is similar to an extended set of rail cars. The order of the vehicles is typically set so that the first vehicle stops at the far sub-stop, and the next vehicle stops at the subsequent one.
A single lane operating with a single sub-stop per station can achieve a corridor capacity of approximately 9,000 pphpd. Convoys can increase capacity by around 50 percent to a maximum of 13,000 pphpd without any reduction in the level of service.
Unfortunately, the convoying or platooning of vehicles is difficult to manage and control. The vehicles must enter the busway in the right order or there will be delays and backing up of vehicles. Further, since customer boardings will vary for different vehicles, the dwell times will also vary. Some vehicles may needlessly wait behind others that have a longer boarding process. Thus, in a convoy system the slowest vehicle will likely set the speed for the entire fleet. For these reasons, multiple sub-stops are best implemented through the provision of passing lanes at stations.
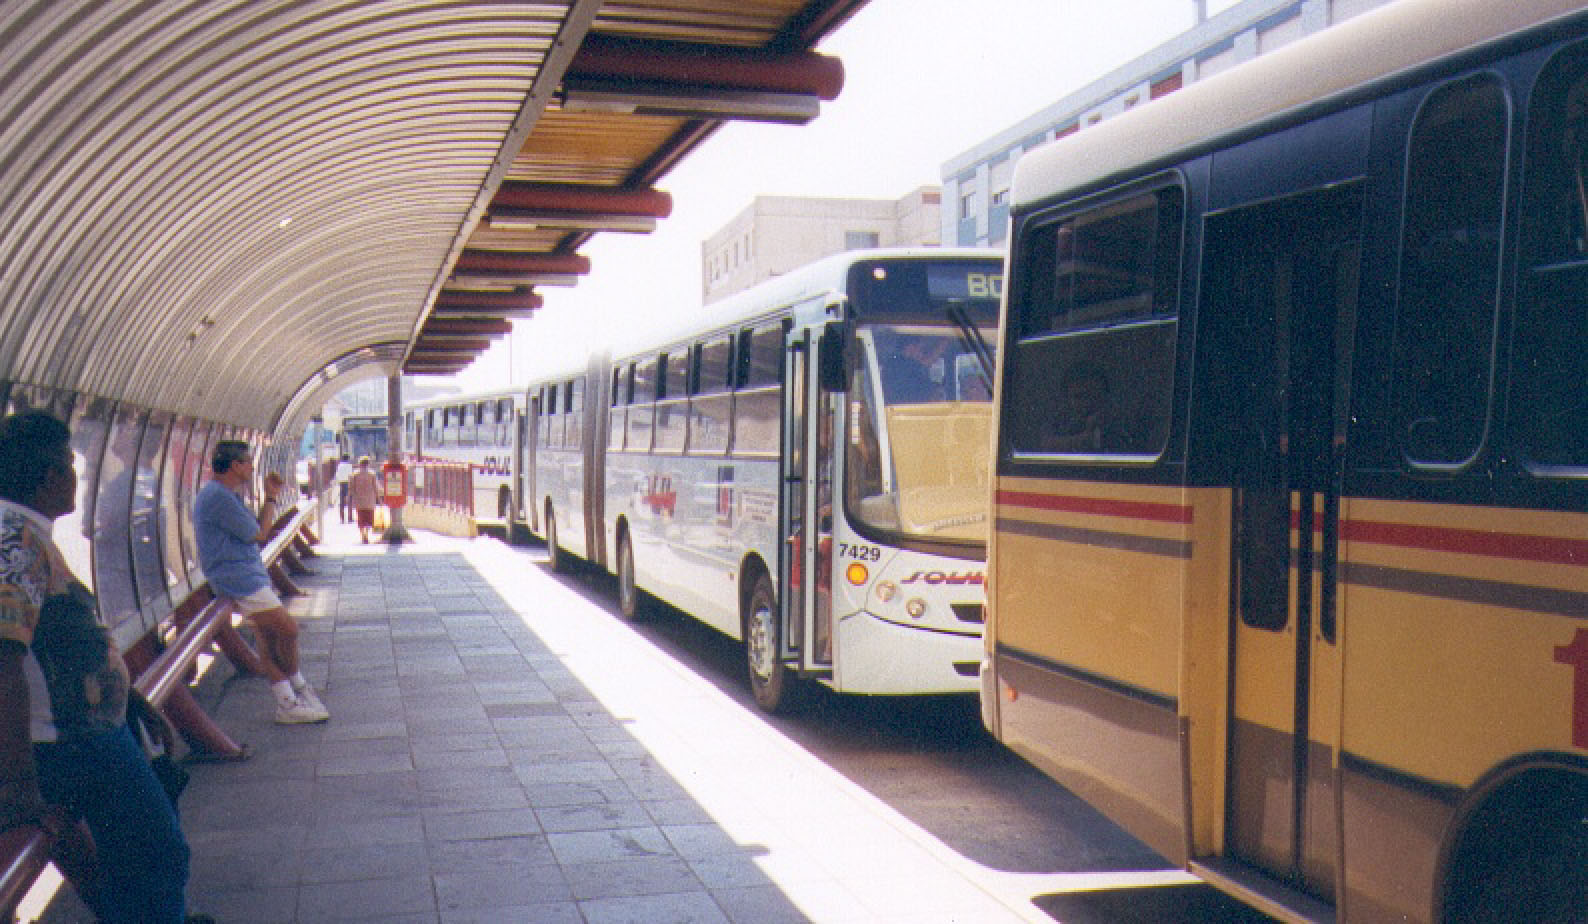
Some conventional systems utilizing convoying have achieved corridor capacities over 20,000 pphpd. Both the Farrapos and the Assis Brasil bus corridors in Porto Alegre, Brazil, reach peak capacities of over 20,000 pphpd through convoying techniques. Nevertheless, the penalty for extending convoying to this level without reducing boarding and alighting times is a reduced level of service in terms of average speed.
Systems may operate as ordered convoys or non-ordered convoys. In an ordered convoy, the vehicles must approach the station in a set order so that the vehicles stop in the designated sub-stop. Signage at the station instructs customers which sub-stop corresponds with their intended route. To manage and control the order of the vehicles entering the busway, a control center in conjunction with automatic vehicle locating (AVL) technology will be essential. Communications between the control center and the drivers allow each vehicle to adjust its position in order to enter the busway at the right moment.
In a non-ordered convoy, the vehicles approach the station in any order, depending on the timing of each vehicle’s entry into the main busway. In this case, customers will not know at which sub-stop their intended route will stop. Even if announcements give customers a brief warning, there is still likely to be some confusion. This situation implies that customers may be running from one end of the station to the other in search of their intended vehicle, or as mentioned previously, will have to flag down the bus to make a second stop at the station in order to pick them up.