8.6Methodologies and Performance Measures
Our virtues and our failings are inseparable, like force and matter. When they separate, man is no more.Nikola Tesla, inventor, 1856-1943
Once the traffic volumes for all modes and for the different scenarios are determined for the target year, it is necessary to express the performance of the roadway facility using one or more quantitative measures that characterize the service experienced by the users. These measures are not only useful to the planners and engineers in evaluating options and impacts, but are also beneficial in describing operations to officials, policy makers, administrators, and the public. It is important that the selected measures are well defined and understood by all involved in the project. Performance measures must include all modes. Often an unwarranted focus is placed on the use of a single general-performance measure (i.e., level-of-service), but which is not necessarily universally applicable. The various available measures that could be used to evaluate the traffic impact of BRT systems can be classified into two broad categories: macroscopic and microscopic measures. Macroscopic level measures focus on:
- Throughput of the road, arterial, corridor, or wider system, measured in passengers per time unit, typically per hour;
- Average speeds along the road, corridor, or in the system;
- System and corridor door-to-door travel times;
- Vehicle emissions from all modes on the corridor or greater transportation system.
On the microscopic level, the measures relate to:
- Specific intersection or bottleneck capacities and demands;
- Average delay per vehicle;
- Number of stops per vehicle;
- The saturation levels of the individual movements at an intersection.
To successfully evaluate the impact of a BRT system, it is essential that not only the performance measures that will be used be defined and confirmed with all stakeholders, but also for the performance-measure criteria to be established and confirmed with all stakeholders. The methodologies and analysis tools that are used to define traffic impacts not only vary among states and provinces in one country, but also vary across the world. However, all methodologies include at least some measure of capacity and a comparison of the expected or current demand and how that relates to the capacity (volume-to-capacity ratio) of the facilities, and often also include operational descriptors such as average speed, average delay, densities, walkability, etc. The latter can be for a specific part of a route (intersection or link), a complete route, or even for a whole corridor or area.
A widely used reference for these types of analyses is the Highway Capacity Manual (HCM) developed by the USA Transportation Research Board (TRB). The 2010 edition of the HCM includes methodologies to estimate individual measures such as automobile travel speed, automobile stop rate, automobile traveller-perception score, pedestrian travel speed, pedestrian space, pedestrian-perception score, bicycle travel speed, bicycle-perception score, public transit vehicle travel speed, public transit wait–ride score, and public transit customer-perception score. It also provides a methodology for combining the individual measures into a single measure for the street, and it is often expressed as a level-of-service (LOS). LOS is also considered a performance measure, and can be computed individually for the automobile, pedestrian, bicycle, and transit travel modes. The individual measures can also be combined to collectively express a single measure for the facility. The latter, a collective approach to describing the performance of the system, is critical for a balanced evaluation of the impact of a BRT system. The HCM has evolved over the years from an automobile-oriented focus to a comprehensive multimodal focus, the multimodal focus only coming to the fore in the 2010 edition. The new edition puts forth principles and methodologies that are useful to consider for capacity analysis of any part of the transportation system and for most modes.
Although the LOS concept is very useful to describe operations with a single measure, the criteria used to define the various modes are based on North American data and standards. These are not necessarily universally applicable, except possibly the criteria for the automobile modes since they are based on performance measures that are field-measurable. Level of service at intersections is related to ranges of average delay per vehicle, in seconds per vehicle. That means that for a given average delay at a junction, the delay is equally experienced by the 1.2 customers in the private vehicle and the 60 customers in the transit bus. If average delay per customer is used as a performance indicator, instead of delay per vehicle, an improvement for transit vehicles will have a much higher impact on intersection average delay.
The criteria for the pedestrian and bicycle modes, which are based on scores reported by users indicating their perception of service quality, however, may vary from country to country. Similarly, the criteria for the public transit modes, which are based on measured changes in patronage due to changes in service quality, will also vary from country to country. This should be kept in mind, and where necessary adapted for local conditions. This is especially important when evaluating pedestrian and bicycle operations in countries where the behavior and prevalence of these modes are significantly different from that in the United States.
The table below summarizes the capacity methodology for the four major modes and the linkages between the modes and the infrastructure elements. Following the methodology presented in the HCM, the level of services of all four of the major modes can be determined.
Apart from understanding the relationship between the demand for a facility and the capacity of that facility, it is important to understand the acceptability of the operations. The latter is typically presented as a level-of-service, which is based on predefined criteria and as follows:
- Automobiles: travel speed as a percentage of base free-flow speed;
- Pedestrians: the density of pedestrians on the facility combined with a score which is based on several factors outlined below;
- Bicycle: a score based on the weighted average bicycle-travel speeds along the facility;
- Public Transit: a score based on the weighted average speeds of the services along the route.
Level-of-service is denoted by a number ranging from LOS A to LOS F, where LOS A represents the best operations and LOS F represents the worst operations where the demand typically exceeds the capacity of the facility. Table 8.1 illustrates the level-of-service for the automobile mode as a function of travel speed.
Table 8.1Automobile LOS Criteria
| Travel Speed as a Percentage of Base Free-Flow Speed (%) | LOS by Critical Volume-to-Capacity Ratio* | |
|---|---|---|
| <= 1.0 | > 1.0 | |
| >85 | A | F |
| >67-85 | B | F |
| >50-67 | C | F |
| >40-50 | D | F |
| >30-40 | E | F |
| <=30 | F | F |
Note: * The critical volume-to-capacity ratio is based on consideration of the through movement volume-to-capacity ratio at each boundary intersection in the subject direction of travel. The critical volume-to-capacity ratio is the largest ratio of those considered.
Source: Highway Capacity Manual, 2010.
The pedestrian LOS presented below is a function of both density of pedestrians and a “score,” which is based on several factors such as:
- Widths of the traffic lane, bike lane, shoulders, and sidewalk;
- Buffer presence of open space, on-street parking, and street trees;
- Volumes and speeds of general traffic and permitted turns on red at signals;
- Crossing distance and distance to the nearest cross walk;
- Pedestrian delay.
Table 8.2Pedestrian LOS Criteria
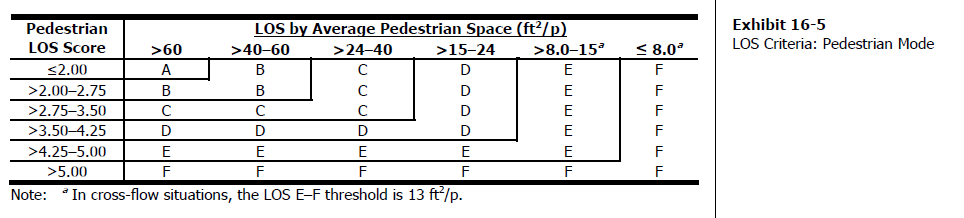
As pointed out earlier, the values used for the actual scoring outlined in the HCM are not necessarily internationally applicable. However, the methodology provides a framework within which calibration for local conditions is possible. The operational requirements for pedestrians vary significantly from hot-dry or hot-humid climates to cold climates. In hot-dry climates, the availability of shade is important, while in cold climates protection against the cold and wind is important. Such factors can be included in the pedestrian scoring and hence the LOS.
The bicycle and public transit level-of-service summarized below is only in terms of a score that is based on a weighted average cycling speed and/or public transit speed. The average cycling speed can be estimated by using the methodology outlined in the HCM 2010, and depends on several variables such as bicycle and vehicle volumes, lane widths, number of vehicle lanes, heavy vehicles, and pavement conditions. The public transit average speed can also be estimated applying the HCM 2010 methodologies, and is dependent on, among other things, running speed, acceleration-deceleration delays, dwell times, reentry delay, as well as the pedestrian scores.
Table 8.3Bicycle and Transit LOS Criteria
| LOS | LOS Score |
|---|---|
| A | <= 2.00 |
| B | > 2.00-2.75 |
| C | > 2.75-3.50 |
| D | > 3.50-4.25 |
| E | > 4.25-5.00 |
| F | > 5.00 |
Source: Highway Capacity Manual, 2010.
Similar to the analysis for pedestrians, the local conditions related to cyclist operations can vary among different countries, depending on the local climate, the prevalence of the mode, and the mindset of motorists toward other mode users. The proposed methodology should be calibrated for local conditions.
The methodology provides a tool that can be used to compare routes based on the operation of all modes. The impact assessment should focus on all modes, and not just the public transit mode or the automobile mode.
What is often overlooked and not always explicitly considered in analysis methodologies and impact-assessment tools is the positive impact of the removal of existing public transit vehicles from mixed-traffic lanes in a corridor. This invariably results in a reduction in bus and general traffic volumes and even a possible increase in capacity along a route. Formal and informal bus and paratransit operations not only tend to stop in one or more curb lanes, blocking the lane for the duration of the stop, but also frequently merge and weave at will through the mixed-traffic lanes. The stopping and weaving movements have a negative impact on the capacity of the operations along a roadway facility. This behavior negatively impacts the automobile stream, and also negatively impacts transit customer safety and comfort, as well as cyclist and pedestrian safety and comfort.