20.5Environmental Performance
The system of nature, of which man is a part, tends to be self-balancing, self-adjusting, self-cleansing. Not so with technology. (Small is Beautiful)E.F. Schumacher, economist, 1911–1977
In addition to complying with the governing legislation, the project must define its minimum environmental standards. Because of the profitability of BRT, it is usually possible to set a higher environmental standard on BRT vehicles than is required under the law without compromising the profitability of operations. As BRT projects play an important role in improving environmental conditions, raising environmental standards that can be financially sustained is generally recommended.
Generally, the following must be considered in assessing the environmental quality of a system:
- Emission levels;
- Ambient air-quality standards;
- Fuel quality;
- Fuel type and propulsion system;
- Levels on interior and exterior noise;
- Ventilation and temperature standards (air renewal/time unit).
In the needs-assessment phase of the project, it is important to set the environmental goal. From an emissions standpoint, there is no one clear technical solution that is necessarily superior to another. Much will also depend on the availability of a particular fuel. Each fuel carries with it different trade-offs of costs, emissions, infrastructure, and potential operating constraints. In some instances, a fuel may emit less of one type of pollutant, but more of another type of pollutant. For example, CNG may do well in terms of reducing particulate emissions, but its life-cycle greenhouse gas emissions may not offer a significant advantage over diesel technology.
Some fuels may produce less local emissions, but may produce significant emissions at the point of electricity generation. Some fuels may produce few emissions from the standpoint of fuel tank-to-wheels but can produce significant emissions when the full fuel cycle is considered (e.g., well-to-wheels). For example, electric vehicles and hydrogen-fueled vehicles may produce zero emissions at the tailpipe, but the emissions generated at the power-plant or through the hydrogen generation process can be quite substantial. Some fuels may work well in ideal conditions, but are more polluting in circumstances when maintenance and road conditions are poor, or at high altitudes.
20.5.1Emission Standards
Box 20.1 BRT Standard: Minimizing Bus Emissions – 3 points maximum
Bus tailpipe emissions are typically a large source of urban air pollution. Especially at risk are bus passengers and people living or working near roadsides. In general, the pollutant emissions of highest concern from urban buses are particulate matter (PM) and nitrogen oxides (NOx). Minimizing these emissions is critical to the health of both passengers and the general urban population.
The primary determinant of tailpipe emission levels is the stringency of governments’ emissions standards. While some fuels, like natural gas, tend to produce lower emissions, new emission controls have enabled even diesel buses to meet extremely clean standards. However, “clean” fuels do not guarantee low emissions of all pollutants. As a result, our scoring is based on certified emissions standards rather than fuel type. Over the last two decades, the European Union and the United States have adopted a series of progressively tighter emissions standards that are being used for this scoring system. Buses must be in compliance with Euro VI and U.S. 2010 emission standards to receive 3 points. These standards result in extremely low emissions of both PM and NOx. For diesel vehicles, these standards require the use of PM traps, ultra-low-sulfur diesel fuel, and selective catalytic reduction. To receive two points, buses need to be certified to Euro IV or V with PM traps (note: 50 ppm sulfur diesel fuel or lower is required for PM traps to function effectively).
Vehicles certified to the Euro IV and V standards that do not require traps emit twice as much PM as vehicles meeting more recent standards. Therefore, these vehicles are awarded one point. Ideally, buses will include contractually stipulated requirements in the purchase order to control real-world NOx emissions
from buses in use, because the actual NOx emissions from urban buses certified to Euro IV and V have
been tested at levels substantially higher than certified levels. Because that is hard to verify, it
is included as a recommendation, but not as a requirement, for receiving the one point.
Zero points are awarded for U.S. 2004 and Euro III standards and less stringent standards, because these standards allow ten times as much PM emissions as the U.S. 2010 and Euro VI standards.
Buses also generate greenhouse gas emissions. Since no clear regulatory framework exists that requires bus manufacturers to meet specific greenhouse-gas emission targets or fuel-efficiency standards, there is no obvious way to identify a fuel-efficient bus by vehicle type. For CO2 impacts, we recommend the use of the TEEMP model, which incorporates The BRT Standard into a broader assessment of project-specific CO2 impacts.
Table 20.5(empty)
| Emissions Standards | Points |
|---|---|
| Euro VI or US 2010 | 3 |
| Euro IV or V with PM traps or US 2007 | 2 |
| Euro IV or V or Euro III CNG or using verified PM trap retrofit | 1 |
| Below Euro IV or V | 0 |
Emission standards are the most typical mechanism for differentiating between the emissions levels of different vehicle options. The standards set forward by the United States Environmental Protection Agency (US EPA) and the European Commission are most typically used to classify emission performance of different technologies. Table 20.5 gives an indication of how European and US EPA standards are related in terms of Nitrogen Oxide (NOx) and Particulate Matter (PM) emissions. For the most part, the two systems follow similar long-term objectives, although there are a few differences.
In many developing nations, the “Euro” (i.e., European) standards are being applied. Table 20.6 provides more detail on the Euro emissions standards, along with the likely fuel and technology requirements.
Table 20.6Euro Emission Standards for Heavy Vehicles
| Level | CO (g/kWh) | HC; (g/kWh); | NOx (g/kWh) | PM (g/kWh) | Certification fuel sulfur content (ppm) | Likely technological requirements |
|---|---|---|---|---|---|---|
| Euro I | 4.5 | 1.1 | 8.0 | 0.612 | 2000 | Higher pressure fuel injection for PM control, timing retard for NOx control |
| Euro II (1996) | 4.0 | 1.1 | 7.0 | 0.25 | 500 | All engines are turbocharged, improved high pressure fuel injection and timing optimization |
| Euro III (2000) | 2.1 | 0.66 | 5.0 | 0.1 | 350 | In addition to above, electronic control for fuel injection, timing retard for NOx, common rail (CR) fuel injection, some exhaust gas recirculation (EGR) |
| Euro IV (2005) | 1.5 | 0.46 | 3.5 | 0.02 | 50 | In addition to the above, further NOx reduction using EGR or selective catalytic reduction (SCR). Some systems will use diesel particulate filters (DPFs) and most will incorporate oxidation catalysts. |
| Euro V (2008) | 1.5 | 0.46 | 2.0 | 0.02 | 10 | Similar to above, with more reliance on SCR. |
| Euro VI; (2013); | 1.5 | 0.13 | 0.40 | 0.01 | 10 |
In order to achieve desired emissions standards or reductions from existing vehicles, several different components of the emissions-control program must be taken into account, including:
- Fuel quality;
- Engine technologies;
- Emission-control technologies;
- Inspection and maintenance program; and
- Driver training.
In order to ensure the greatest possible emissions reductions from both the new vehicles and the existing fleet, a comprehensive emissions-control program will be required.
In determining the appropriate emissions standards and technologies within a specific city or fleet perspective, many considerations must be taken into account, including the reliability of the fuel supply to meet quality standards, the mechanisms and incentives that are in place to ensure follow-up and compliance with driver training and maintenance procedures, and the applicability of the technology in context to the operating conditions of the fleet. Each component has a different ramification in the developing-nation context. Can the quality of the incoming fuel be assured, and how will adulteration of fuels be avoided? If advanced engine and emission-control technologies are utilized, how robust are these technologies in developing-city conditions? If an improved driver and maintenance program is established, what mechanisms and incentives are in place to ensure follow-up and compliance?
In addition to emission standards, system planners may also specify the maximum allowable age of vehicles operating on the system. The age specification will help to maintain long-term system quality as well as ensure all private operators are competing on an equal basis. The maximum age will also play a fundamental role in calculating the operator’s amortization rate for the vehicle.
20.5.2Fuel Quality
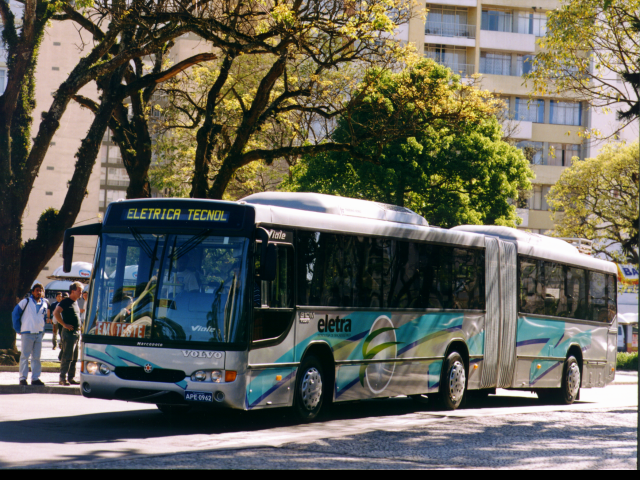
In a BRT project, it is fairly typical that the BRT authority has control over the vehicle standard, but only limited influence on the fuel standard and fuel availability. However, in several cases a BRT project has been used to pressure the energy companies to provide cleaner fuels. The additional operational controls within a BRT system may make it possible to ensure a higher-quality fuel supply than is available within the rest of the city, and should make it possible to reduce the problems of fuel adulteration. In any case, the technical specification has to be set with awareness of available fuel quality. In Ecuador, the city of Quito maintains higher-fuel quality standards than other cities in the country. This higher level is in part due to the city’s unique climatic and geographical conditions, 2,800 meters of elevation, as well as the presence of a BRT system.
It is generally best to set the minimum-allowable vehicle-emission standard without specifying a specific technology, as this gives the operator greater flexibility to consider a range of factors such as fuel costs, fuel availability, maintenance, reliability, refueling times, and performance when complying with the standard. These factors will vary by location and situation, and the private sector may be in the best position to weigh the relative economic value of each factor. For instance, in Bogotá, the BRT authority specifies that vehicles must meet a minimum Euro II emission standard and have set forward a schedule to move towards Euro IV standards. TransMilenio does not specify a particular fuel or propulsion technology. These decisions are left to the private operators. There are also incentives in place for operators to propose vehicles exceeding the minimum standard. Such operators receive more points during the bidding process.
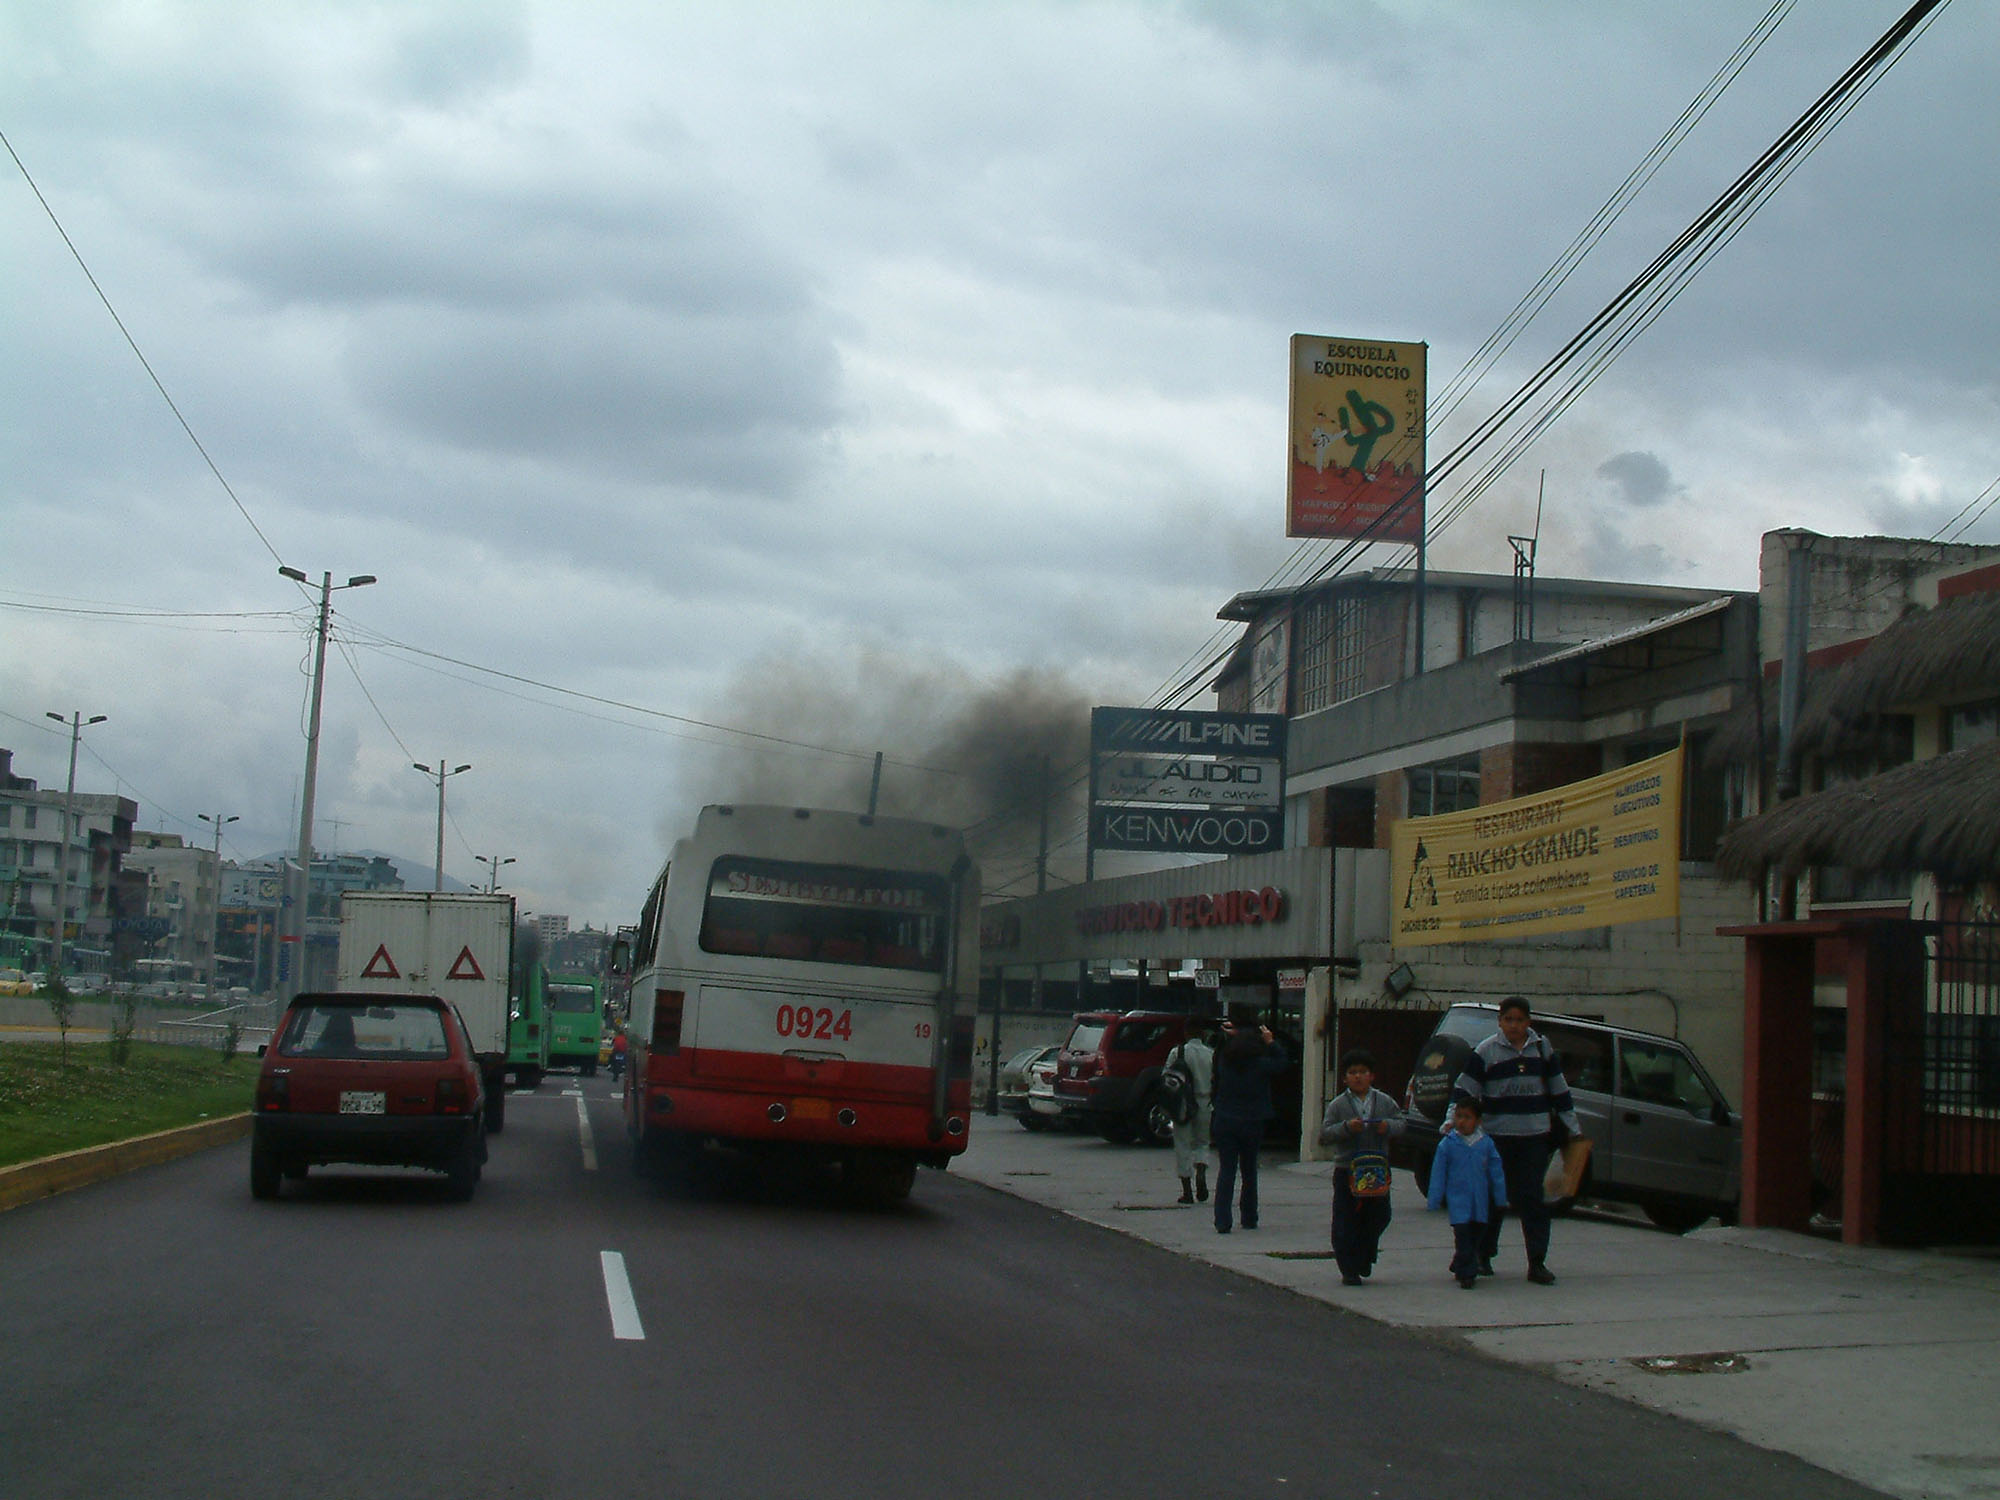
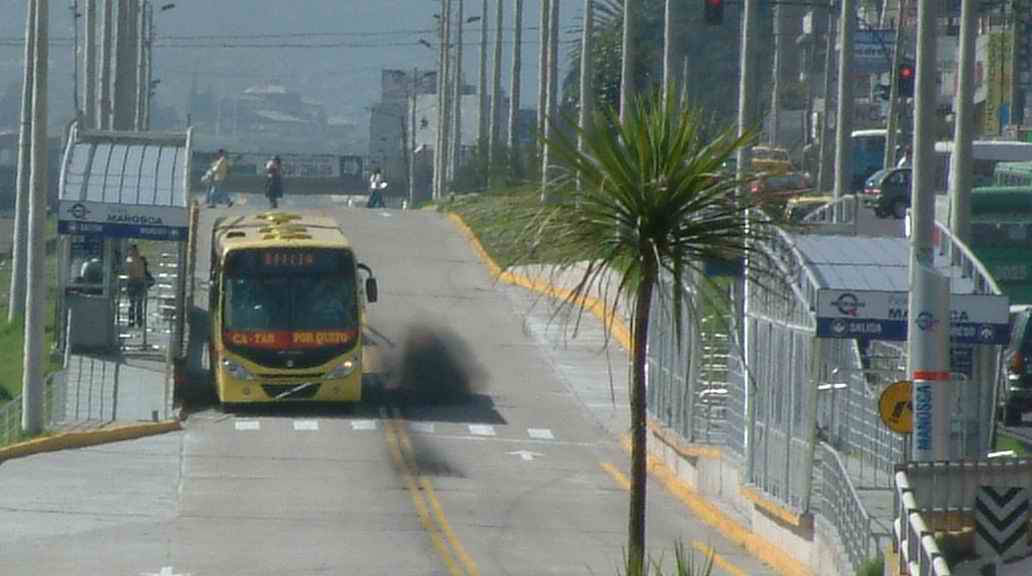
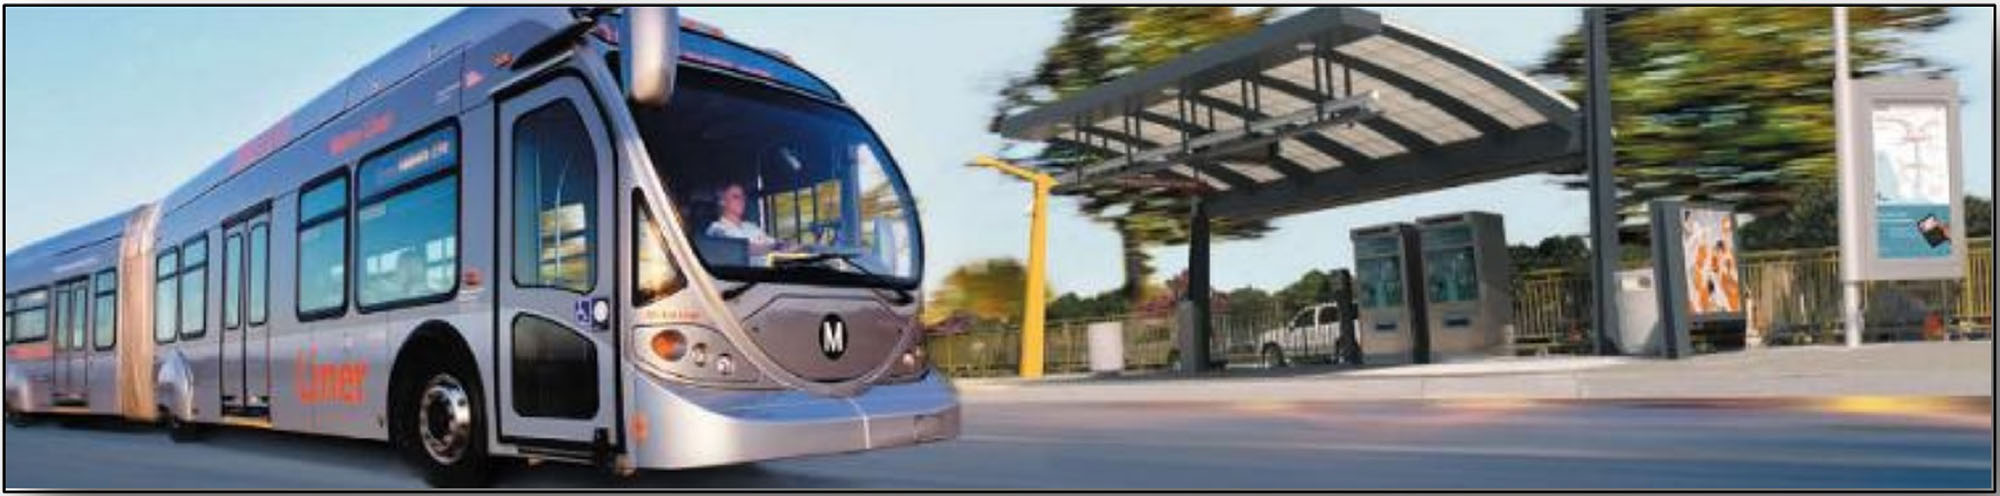
For BRT, the cleanest new vehicles that are compatible with available fuel quality are generally advisable. In some cases, BRT systems have been operated with a mismatch between the vehicle technology and the available fuel (Figure 20.28). Somewhat cleaner vehicles may be able to cope with dirtier fuels but may face increased maintenance issues. While Euro II and III vehicles are generally more forgiving than Euro IV or V vehicles, higher sulfur levels than are found in certification fuels may still increase maintenance costs for sensitive electronic engine equipment, such as high-pressure or common rail fuel injection. Lower sulfur fuels will reduce maintenance costs and improve vehicle durability for all vehicles, regardless of emissions standard.
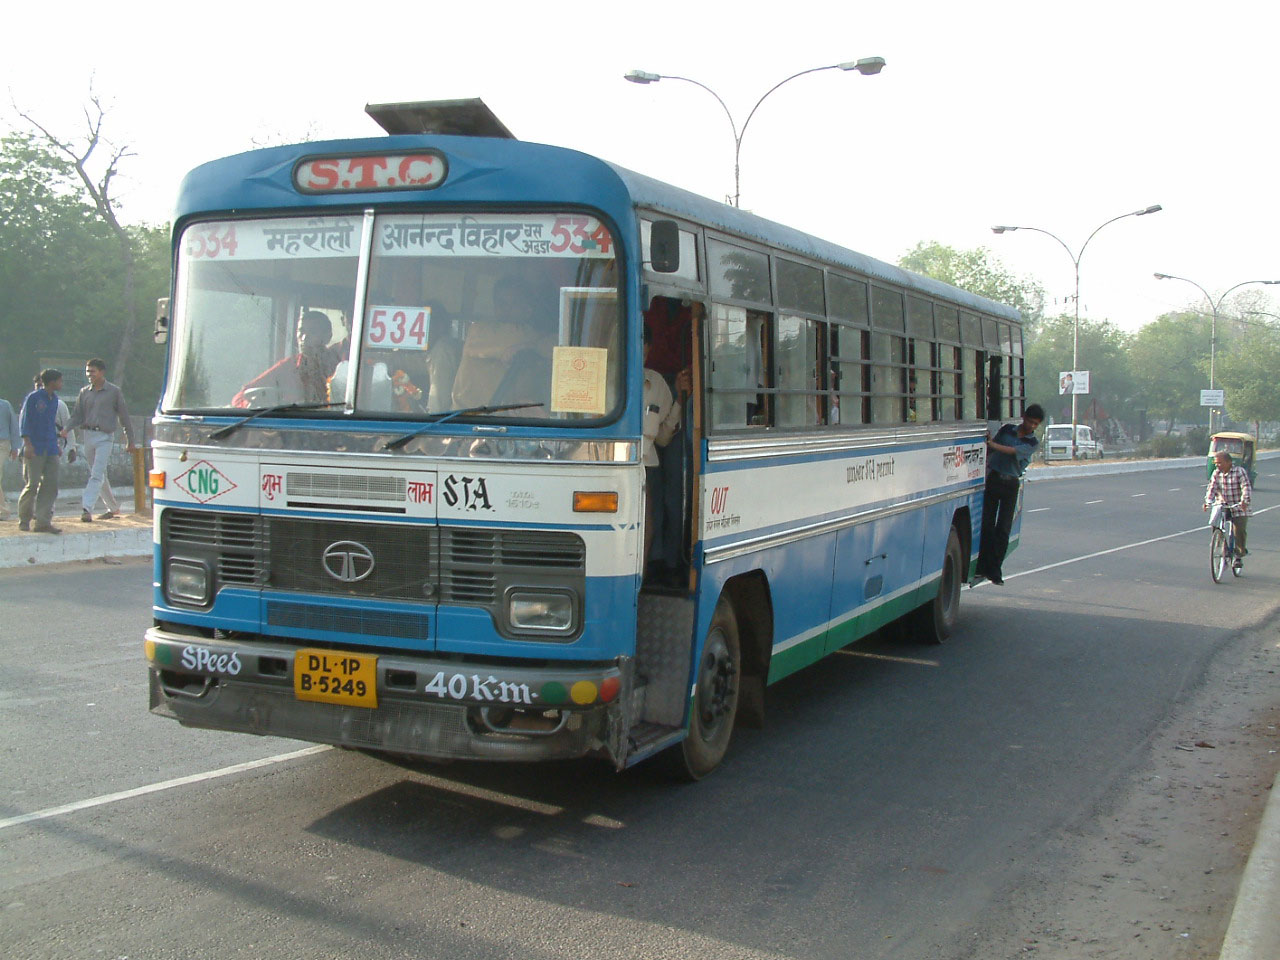
However, in some instances, there may be reason to specify a particular fuel type. In Delhi, India, all public-transport vehicles have been mandated to utilize compressed natural gas (CNG) as fuel (Figure 20.29). Adulterated fuels are those that have been tampered with by suppliers in order to improve their profits. For example, some fuel suppliers in India mix kerosene, which is subject to much lower taxation rates, into the diesel. The result of fuel adulteration such as this is poorly performing vehicles, higher emissions and air pollution, and more costly maintenance requirements. Thus, requiring Euro II or Euro III technology can be meaningless in such a scenario, since there is little control on the input fuel. By contrast, it is quite difficult to adulterate CNG, and thus its quality is more assured. Despite the rationale of this course and the relative availability of CNG in India, Delhi’s conversion from diesel fuels to CNG has been fraught with conflicts and political recriminations. Ultimately, it required the intervention of the national Supreme Court to ensure that the conversion process was finally undertaken.
20.5.3Fuel Types and Propulsion Systems
Many governments and promoters of clean technology rightly see BRT as a possibility for introducing cleaner vehicle technology. Because of BRT’s profitability, it creates the potential of having a much cleaner vehicle without undermining the profitability of the service. However, this profitability is case-specific, and clean technologies should not be forced on BRT systems without first assessing the impact the technology will have on the quality of service, the profitability of the system, the transparency of the vehicle procurement process, and other factors.
The choice of fuel and propulsion technology will have a profound impact on operating costs, maintenance costs, supporting infrastructure, as well as emission levels. Local circumstances play a central role in fuel choice, as the availability of a fuel and experience in maintaining a particular vehicle technology are key factors. Further, as attention focuses more and more on the human and environmental costs of both local pollutants and global climate change, system developers are under increasing pressure to deliver cleaner vehicles options.
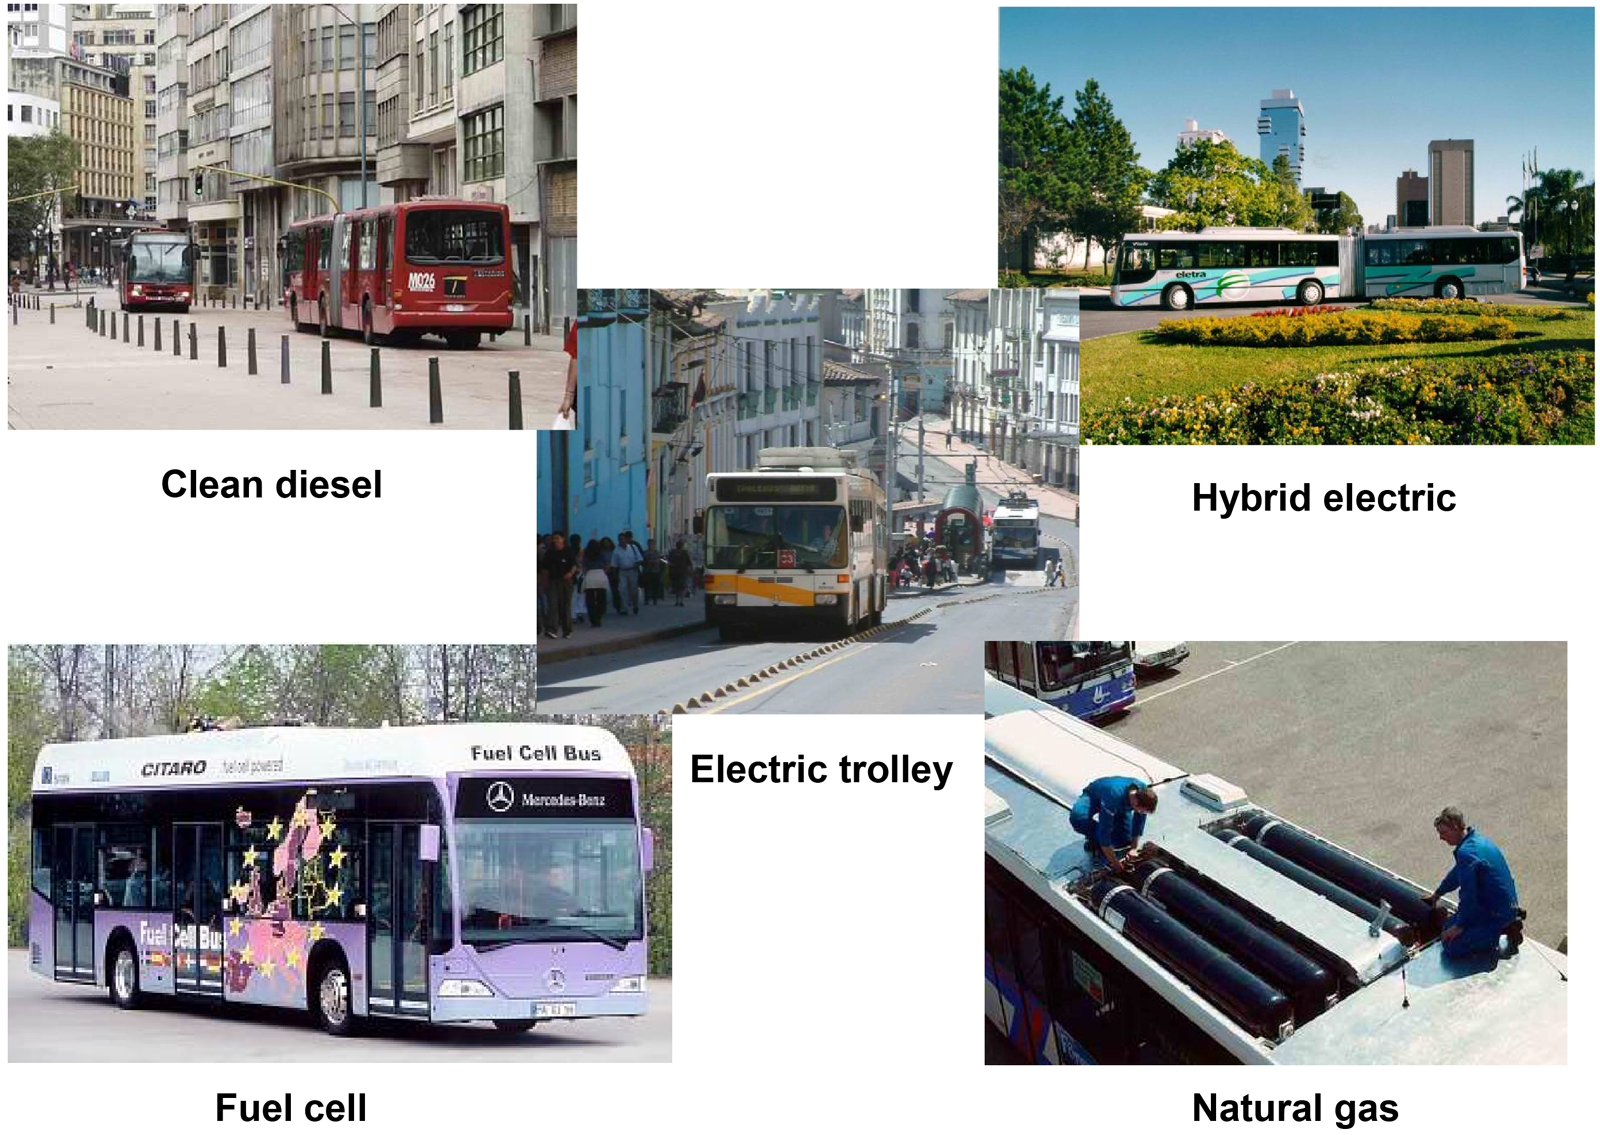
The following is a list of some of the most common fuel options currently being considered for public-transport vehicles (Figure 20.30):
- Diesel, both standard and clean;
- Compressed natural gas (CNG);
- Liquid petroleum gas (LPG);
- Electric trolleybuses;
- Bio-fuels, such as bio-diesel and ethanol;
- Hybrid-electric (diesel-electric and CNG-electric);
- Hydrogen (fuel-cell technology).
A range of other possibilities also exists, such as fly-wheel technology, di-methyl ether (DME), and blended fuels (e.g., water-in-oil emulsions).
Choosing the type of engines that will be purchased and the fuel that will be used requires that consideration be given to several important issues. The following factors are the most important when considering a fuel and propulsion technology:
- Fuel availability and price volatility;
- Vehicle cost;
- Reliability;
- Government policy;
- Environmental impact.
Diesel (Standard and Clean)
A clean-diesel system implies that the propulsion-system technology and the fuel quality are such that the end result is much lower emissions than a standard diesel vehicle. The International Energy Agency notes that (IEA, 2002b, p. 61):
“Diesel engines are recognized and favored worldwide for their fuel efficiency, excellent durability and low maintenance requirements. They offer the convenience of using a liquid fuel that is easily dispensed through an established fueling infrastructure. The technology is mature, widely produced and competitively priced. Although diesel engines have historically produced high levels of pollutant emissions, especially oxides of nitrogen (NOx) and particulate matter (PM), recent improvements in engines and fuel and emissions-control technology have resulted in new diesel systems for buses that are substantially cleaner than they were only a few years ago.”
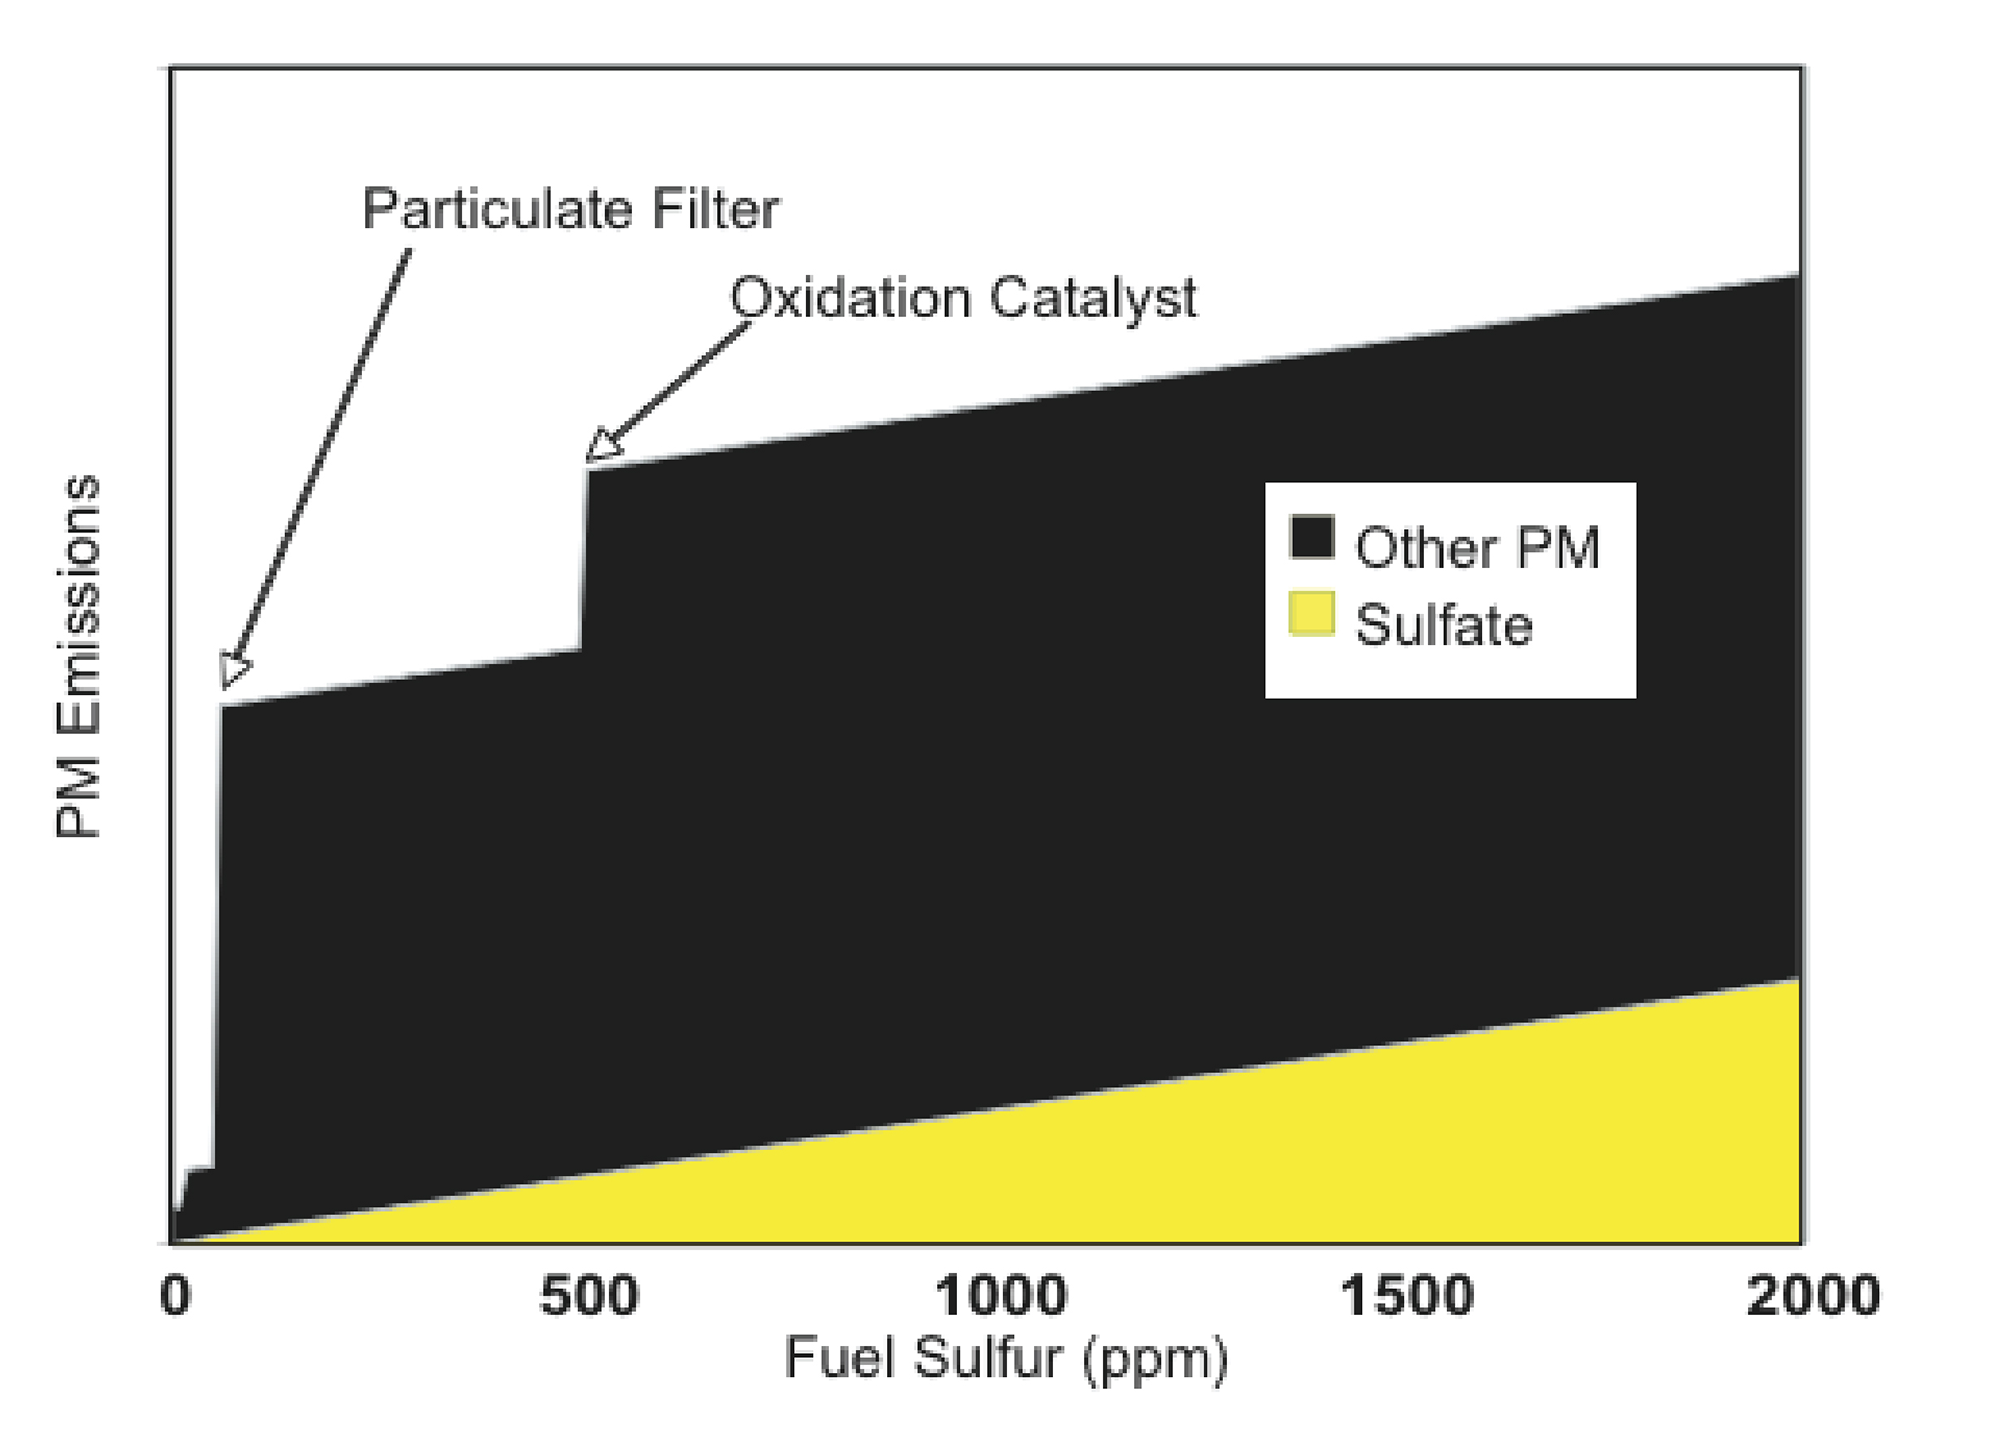
For diesel, sulfur content is the most critical factor to consider, as many of the pollution-control devices used in the cleaner buses require lower sulfur fuels. In some cities, diesel fuels may contain over 2000 parts per million (ppm) of sulfur. To achieve Euro II standards, a sulfur level of less than 500 ppm is likely to be required. To achieve “ultra-low-sulfur diesel” (ULSD), the fuel must contain less than 50 ppm. Many emission-control technologies will only function properly if the fuel sulfur levels are below acceptable levels.
Reducing sulfur from diesel fuel also carries with it other emissions benefits, such as simultaneously also reducing particulate matter (PM), which is a key pollutant from a public-health perspective. As shown in Figure 20.31, sulfur contributes to the production of particulate matter in all diesel engines. At higher sulfur levels, sulfate can account for up to 5 to 15 percent of PM emissions from diesel. At lower sulfur levels, after-treatment emissions controls can reduce PM emissions much more substantially, either as retrofit devices or as standard equipment on new vehicles meeting more stringent standards. Diesel oxidation catalysts, which can reduce PM emissions by 20 to 30 percent, can generally be used with sulfur levels up to 500 ppm. Diesel particulate filters, which can reduce more than 90 percent of PM emissions, generally require sulfur levels to be under 50 ppm.
Hydrocarbons (HC), carbon monoxide (CO), and even nitrogen oxides (NOx) are also affected by emissions standards and contingent on fuel quality. As can be seen in Table 20.5, the Euro standards are scheduled to reduce emissions of all major pollutants. Euro II and III each represent a 60 percent reduction in PM emissions from the previous standards. Euro IV standards have 80 percent lower PM emissions than Euro III, and thus representing a 97-percent reduction from Euro I standards. The cleaner the vehicle, however, the more sensitive it is to fuel quality.
Emissions from diesel vehicles will vary depending on local conditions such as altitude, atmospheric pressure, humidity, and climate. The quality of ongoing vehicle maintenance and the integrity of the fuel supply chain will also affect specific system emissions. Nevertheless, with the right fuel quality, diesel vehicles can produce emissions reductions in line with many of the more costly alternative fuels. In general, it can do so with a lower vehicle cost and with a more robust maintenance regime.
Compressed Natural Gas (CNG)
CNG is highly touted as a reliable fuel option that “inherently” achieves lower emissions. CNG contains virtually no sulfur and naturally burns quite cleanly. However, CNG is not a perfect solution. For some emission types, the performance of CNG may not be that much better than clean diesel vehicles.
In the case of greenhouse-gas emissions, the entire well-to-wheels analysis of CNG production, distribution, and use may imply that there is little, if any, advantage over diesel. Upstream methane losses along pipelines can significantly increase total life-cycle greenhouse emissions for CNG. Some studies estimate that with the inclusion of methane leakage, CNG will actually produce significantly more total greenhouse-gas emissions (CVTF, 2000).
There are also other issues to consider with CNG. The low energy density of the fuel means that the gas must be compressed for on-board storage in large, bulky cylinders. CNG vehicles also require different maintenance skills that may not be common. In some cases, CNG vehicles may face power issues on steep hills, at high altitudes, and in some temperatures. The refueling infrastructure for CNG can also be costly to develop.
Refueling time is also a consideration for CNG vehicles. Typically, refueling time per vehicle will range from 20 to 40 minutes.
Nevertheless, CNG holds much potential for emission reductions of PM and sulfur oxides, and thus, if the fuel is available locally, then the technology should be given serious consideration. Further, as experience grows with CNG, the technology is becoming increasingly robust from a maintenance standpoint.
Electric-Trolley Vehicles
Electric-trolley vehicles are a well-established technology that produces zero emissions at the point of use. The total fuel-cycle emissions of electric-operated vehicles will depend upon the fuel used in the electricity generation. Fossil-fuel-based electricity generation, such as electricity from coal or petroleum, will produce high levels of total emissions, while renewable sources, such as hydro-electric and wind sources, will be relatively emission free. Thus, in countries with clean electricity generation, electric trolleys can be a low-emitting option to consider. Electric-trolley vehicles are also extremely quiet in operation. Table 20.6 summarizes the different issues to consider in choosing electric-trolley technology.
Table 20.7Advantages and Disadvantages of Electric Trolleybus Technology
| Advantages | Disadvantages |
|---|---|
| Zero emissions at point of use (total emissions will depend on fuel type for electricity generation) | Vehicles can cost up to three times the amount of a comparable diesel vehicle |
| Quiet operation | Operating costs highly dependent on electricity prices; subsequent electricity deregulation can destabilize financial model |
| Smooth ride characteristics | Route modifications are very expensive |
| Longer vehicle life (up to twice the vehicle life of diesel vehicles) | Longer implementation time required to build the electric conduit network |
| Risk of service disruption during power failure unless vehicles have backup diesel motor | |
| Infrastructure costs can be over twice that of a non-trolley BRT system | |
| Presence of wiring, posts, and transformers can create aesthetic concerns, particularly in historical centers | |
| If the electric-trolley vehicle pantograph comes off the overhead wires, it can cause significant system delay |
Biofuels (Ethanol and Bio-Diesel)
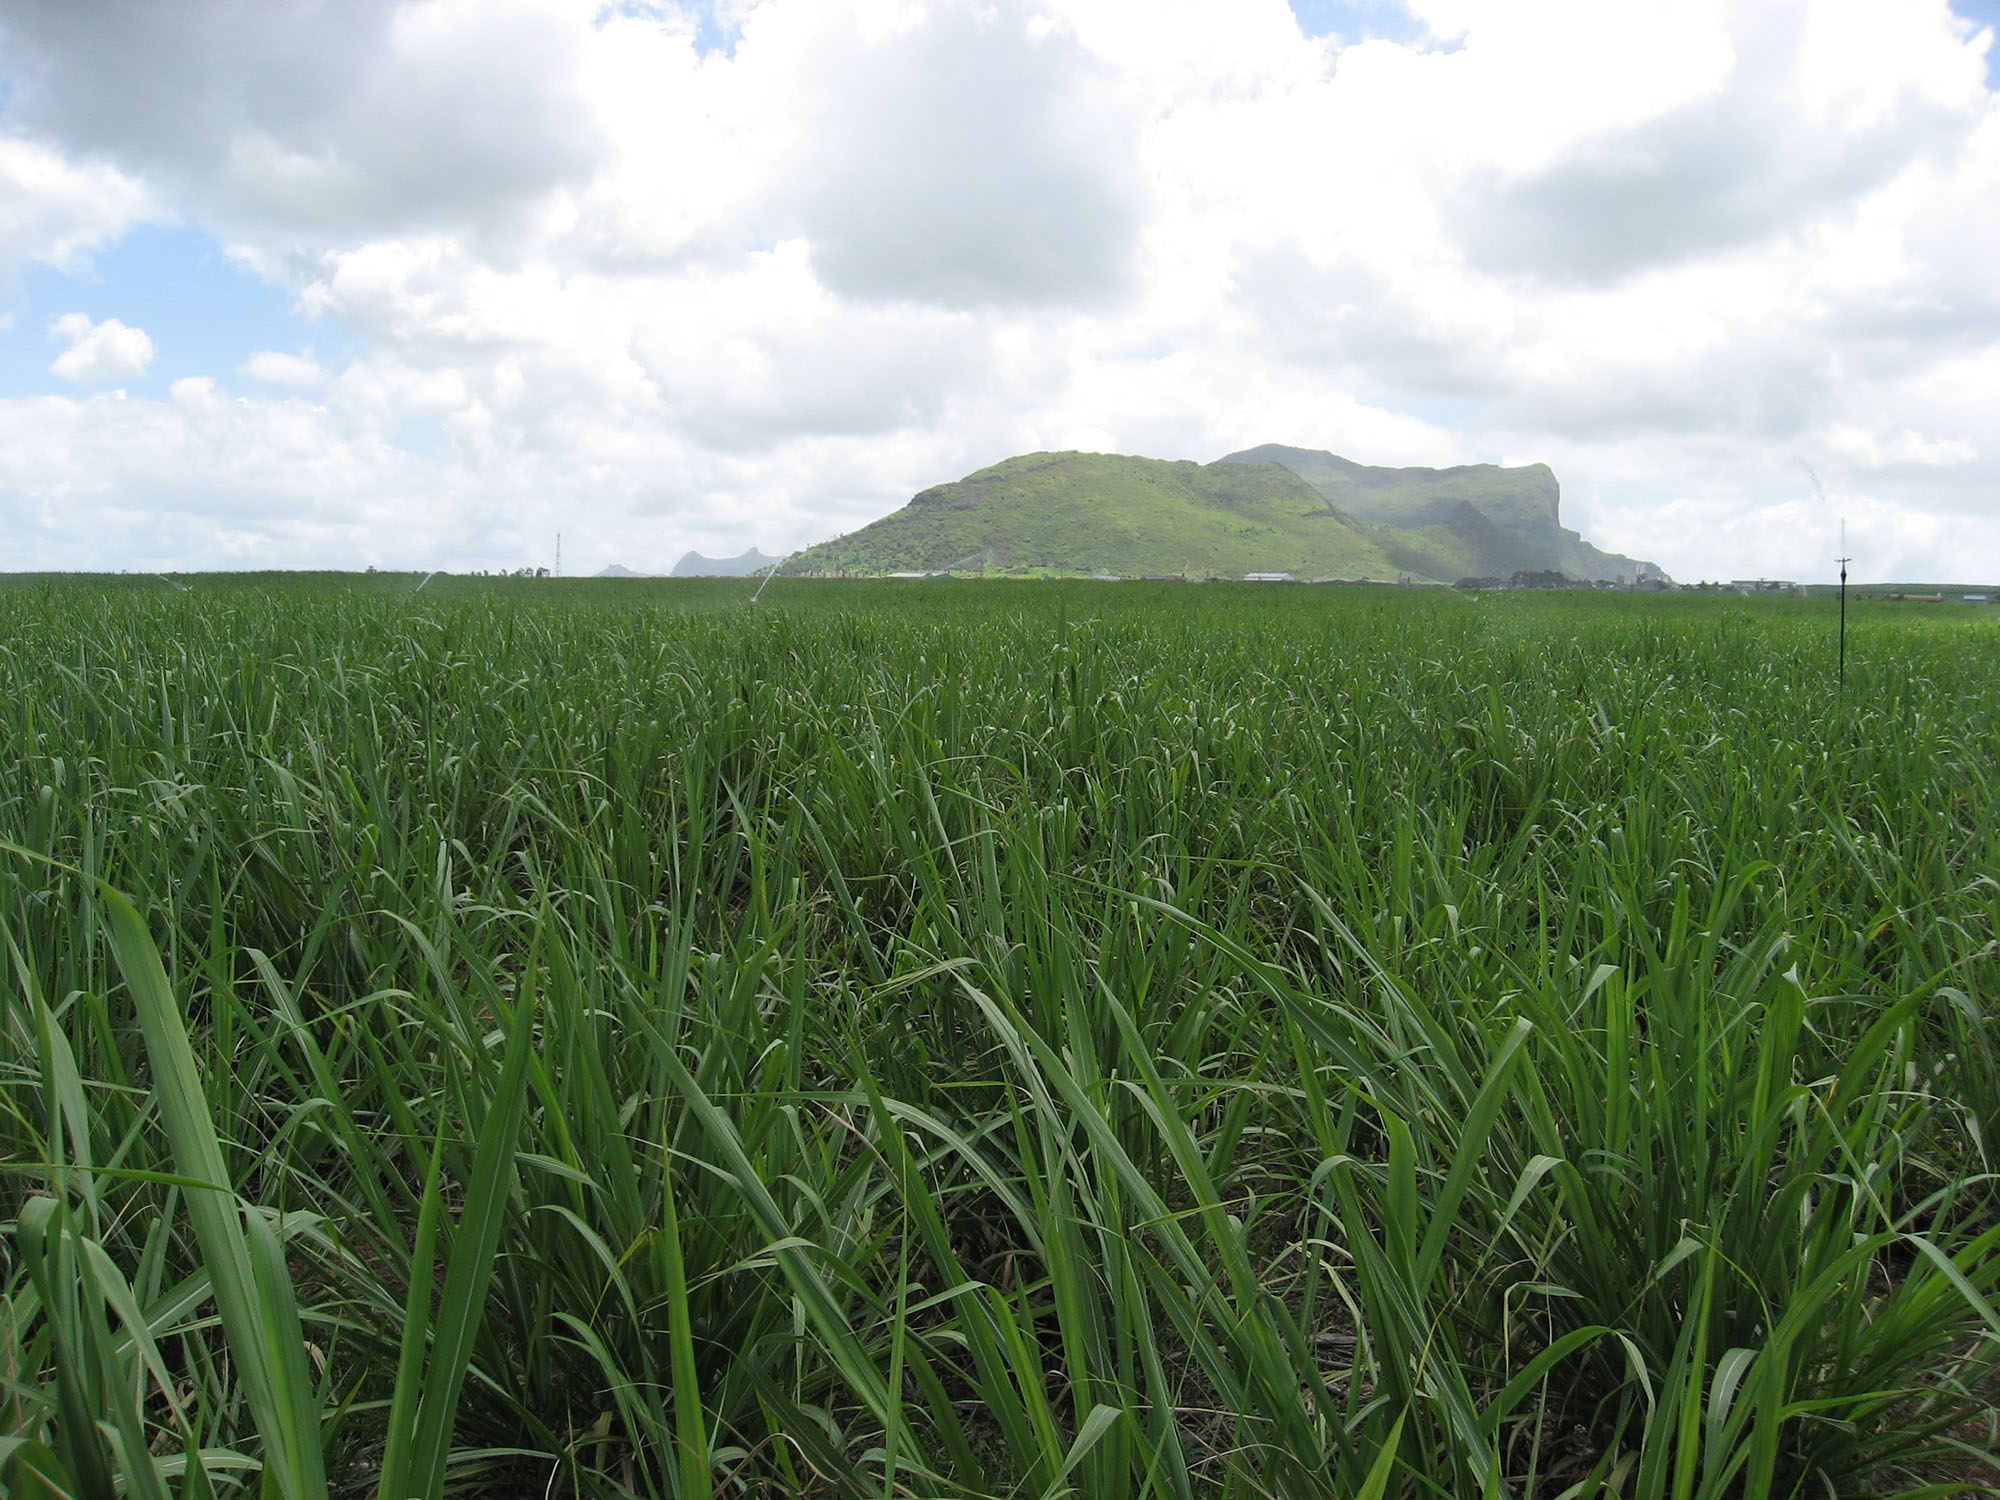
Ethanol is a fuel produced from the fermentation of sugars in carbohydrates, derived from agricultural crops like corn and grains, wood, or animal wastes. Currently, ethanol is derived predominantly from corn and sugar cane (Figure 20.33). Brazil possesses an extensive ethanol program using sugar cane. In the future, cellulosic ethanol may become viable, in which the fuel can be derived from a broader range of plant and agricultural species. However, commercial production of cellulosic ethanol is yet to be fully realized.
Bio-diesel is a fuel derived from biological sources that can be used in diesel engines instead of petroleum-derived diesel. Through the process of transesterification, the triglycerides in the biologically derived oils are separated from the glycerin, creating a combustible fuel. Bio-diesel fuel is currently derived predominantly from soya.
Biofuels hold the potential to deliver a product with net zero greenhouse-gas emissions. The CO2 emitted by biofuels can be balanced by the CO2 absorbed during plant growth, potentially resulting in a fixed carbon cycle. However, the reality is more complicated. Total greenhouse emissions from biofuel production are still quite poorly understood, including certain factors that could increase net greenhouse gas emissions considerably. These factors include: energy inputs into the cultivation of crops; secondary emissions that have climate-change impacts (e.g., black soot); amount of fertilizer use and resultant emissions of nitrous oxide (N2O); amount of pesticide use; and, type of biomass being displaced by energy crops. In some instances, such as soy-based fuels, the resulting greenhouse-gas emissions from nitrogen releases may overwhelm other benefits (Deluchi, 2003). Additionally, it is unclear if the amount of agricultural land is sufficient to produce biofuels in a quantity sufficient to dramatically offset petroleum fuels (IEA, 2004).
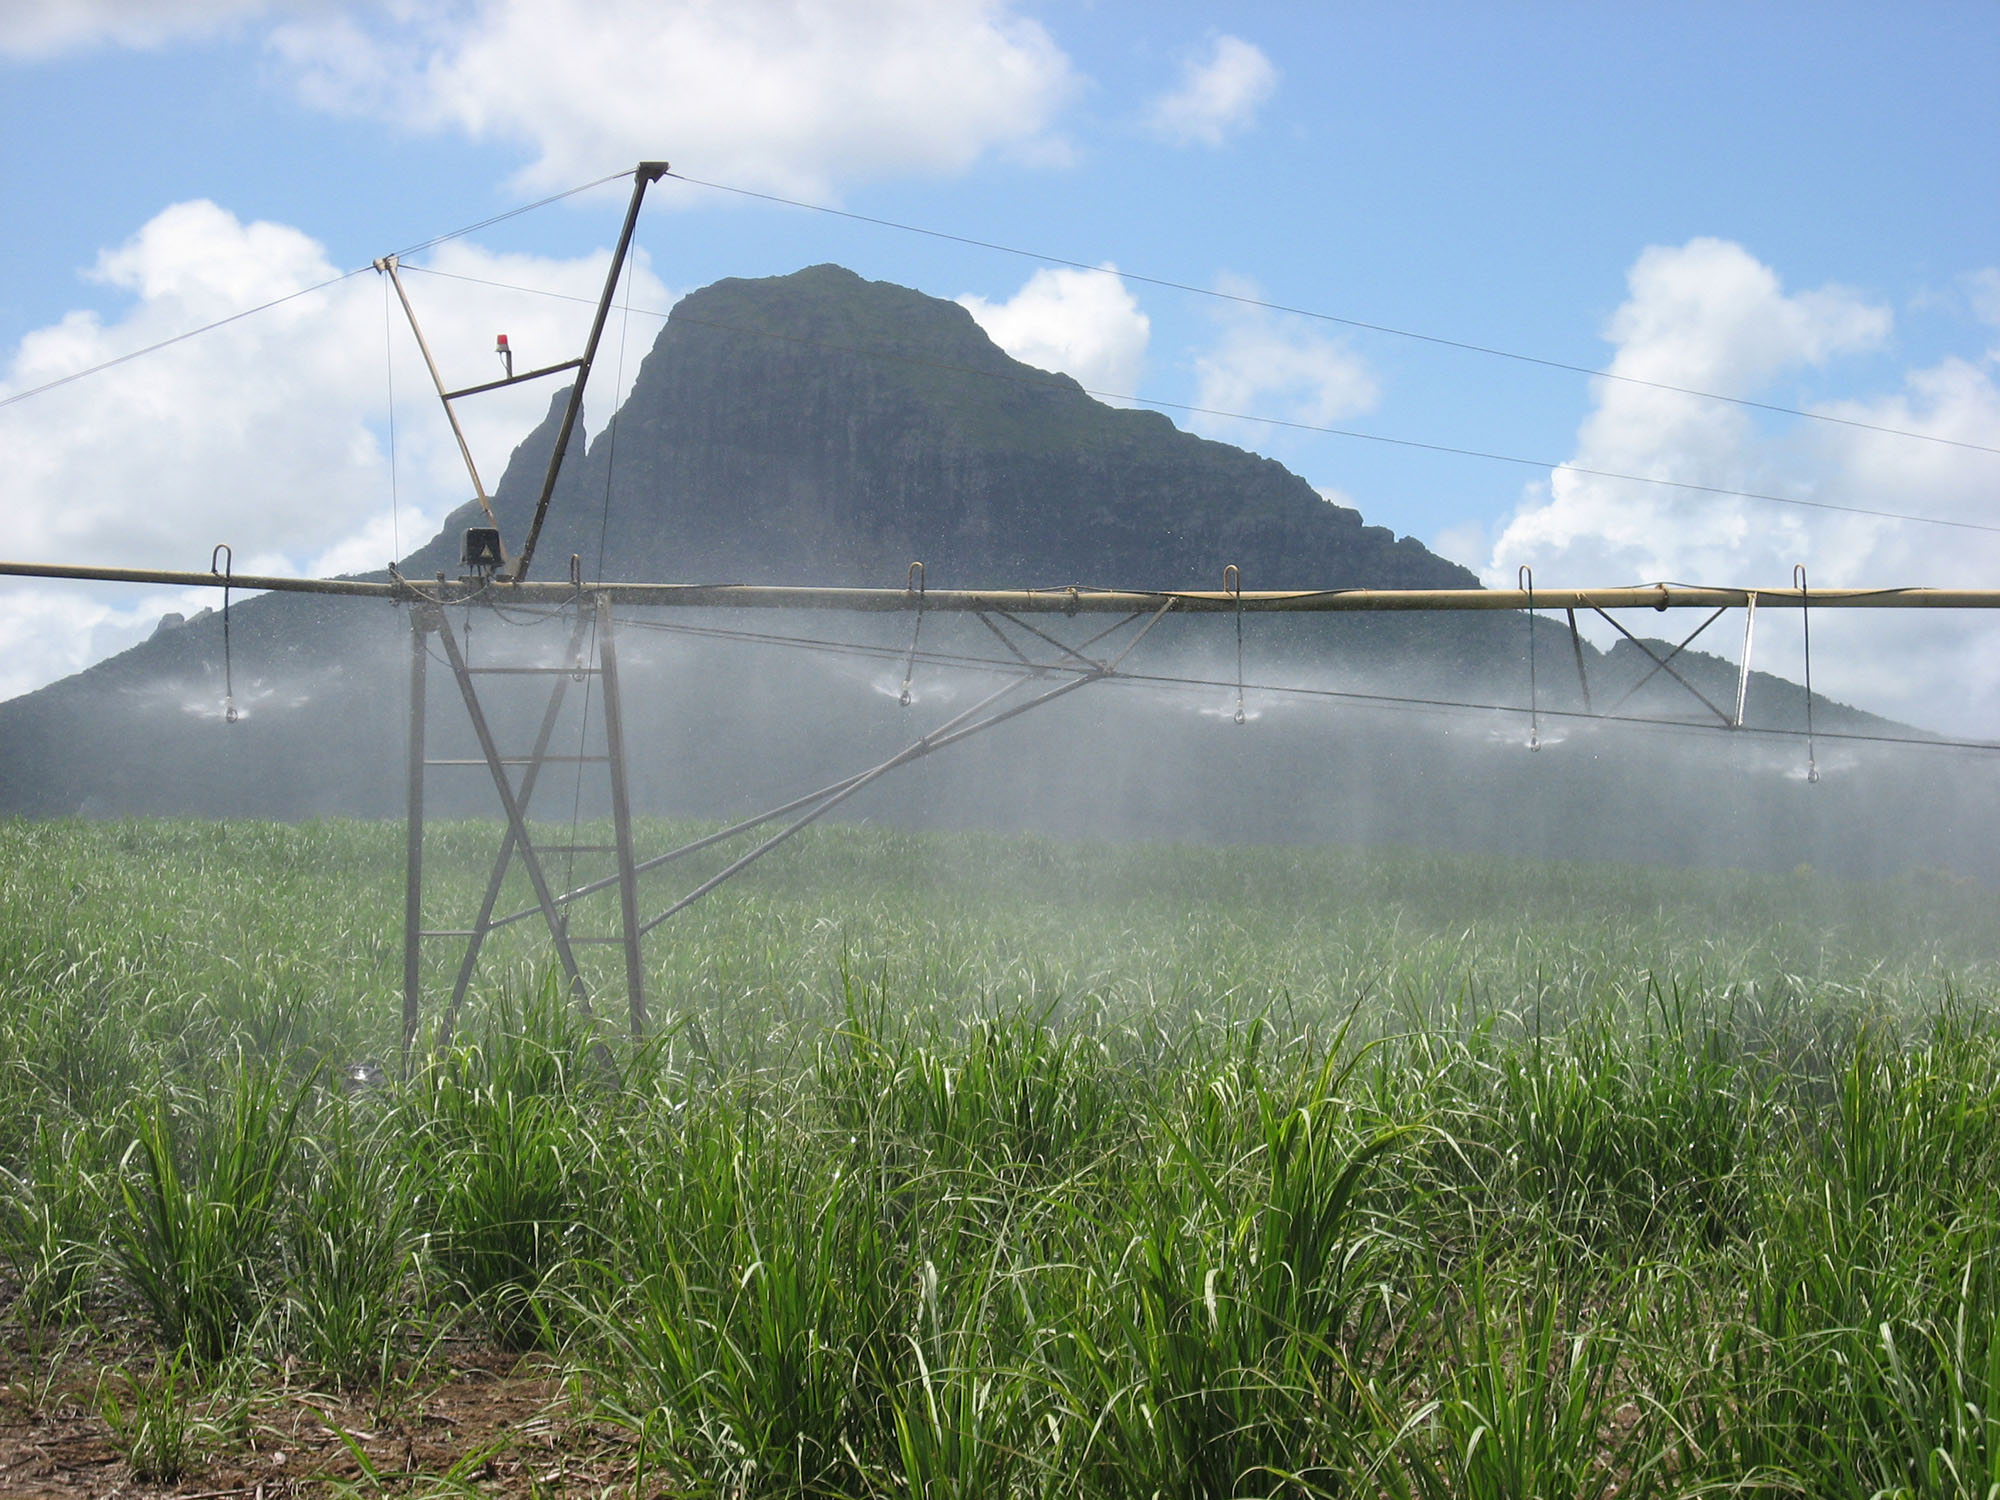
Biofuel production may have an array of other unintended side effects. As the market for biofuel builds, there will be growing pressure on sensitive ecosystems to be converted into crop production. This phenomenon is already clearly evident in the Amazon region of Brazil, where increased demand for soya is leading to further illegal destruction of the Amazon ecosystem. Each year, approximately 20,000 square kilometers of the Amazon rainforest are cleared for agricultural use (Economist, 2006). More intensive biofuel production can also imply greater depletion of input resources such as soil quality and water (Figures 20.34 and 20.35).

There is also increasing concern over the impact biofuel production will have upon food prices. It is reported that the grain required to fill the typical 95-liter petrol tank of a sport utility vehicle with ethanol will feed one person for a year. The grain to fill the tank every two weeks over a year will feed 26 people (Brown, 2006). In the United States, the amount of the corn (maize) crop dedicated to ethanol production increased 34 percent from 2006 to 2005. In 2006, some 54 million tons of maize went to ethanol production, even though ethanol only represents a small percentage of the fuel used in vehicles in the United States (Planet Ark, 2006). In late 2006, an increase in maize prices due to biofuel demand caused tortilla prices to triple in Mexico. Since tortillas represent the staple of the local diet, many low-income families were severely affected by these increases. With strong protests from the population, the government was eventually forced to adapt price controls. These types of conflicts may become more common as the market for biofuels expands.
Hybrid-Electric Vehicles (Diesel-Electric and CNG-Electric)
Hybrid-electric vehicles will likely be one of the first of the advanced technologies to gain large-scale acceptance in the market. Hybrids utilize both conventional fuels (e.g., diesel, CNG, etc.) and electrical motors to propel the drive-train. Electric power can be generated during vehicle deceleration and then utilized to operate motors attached to each wheel. Since electric motors are used for part of the vehicle’s operation, hybrids offer superior fuel economy, reduced emissions, and lower noise levels (Figure 20.36).
However, even with this technology, the emission-reduction benefits can vary depending on the driving-duty cycle. The city of Seattle, Washington, USA has made one of the largest investments in hybrid-electric technology within its bus system. However, despite manufacturer claims of fuel efficiency gains of 25 percent or more, the initial results in Seattle were significantly less due to the route choice (Hadley, 2004). If the bus-duty cycle does not involve sufficient stop-and-go travel, then the efficiency gains from regenerative braking are not realized. The additional weight of the hybrid-electric vehicle offsets the gains from the on-board electricity generation (Wright and Fulton, 2005).
Like all new technologies, a certain period of adjustments and experimentation are required prior to optimum results being achieved. However, the complexity of propulsion system and cost of the hybrid components mean that hybrids may not be well suited for all developing city applications.
Currently, efforts are being made to produce hybrid-electric vehicles in Brazil. Because of various local conditions, such as lack of driver familiarity with the technology, the environmental benefits have been less than anticipated, but the problems are likely to be resolvable.
Hydrogen (Fuel-Cell Technology)
National research and development budgets have heavily invested in fuel-cell technologies. In 2003, the United States launched its five-year Hydrogen Fuel Cell Initiative with a commitment of US$1.7 billion in research funding. Likewise, the European Union is supporting a US$3.7 billion public-private partnership in a 10-year fuel cell development program. In 2003, Japan dedicated US$268 million of its government research budget to fuel cells. Likewise, other governments such as Canada and China also have their own fuel-cell program (Science, 2004).
Fuel-cell vehicles are undergoing testing in both developed and developing cities. Through a grant from the Global Environment Facility (GEF), several developing cities, such as Beijing and Cairo, have had an opportunity to evaluate the technology. However, none of these cities are actually operating full fleets with these technologies. The costs, environmental benefits, and performance of these vehicles are not entirely proven. Since most hydrogen is currently produced from electrolysis, the emissions benefits are directly tied to the type of technology utilized for the generation of the electricity.
The International Energy Agency notes that there are no certainties when hydrogen fuel cells will become commercially viable (IEA, 2004). Hydrogen storage capabilities, the dependence on expensive rare-metal catalysts (e.g., platinum), and the development of appropriate infrastructure all represent formidable uncertainties in the timely delivery of a commercial product. By depending solely on a technology without a known delivery date, action on transport-sector emissions can be significantly delayed:
“…by skewing research toward costly large-scale demonstrations of technology well before it’s ready for market, governments risk repeating a pattern that has sunk previous technologies, such as synfuels in the 1980s. By focusing research on technologies that aren’t likely to have a measurable impact until the second half of the century, the current hydrogen push fails to address the growing threat from greenhouse gas emissions from fossil fuels” (Science, 2004).”
20.5.4Fuel Availability and Price Volatility
Not all fuels are widely available. Many alternative fuels may simply not be available at the time that the BRT system is going into operation, and thus fuel availability will constrain the selection of propulsion technology.
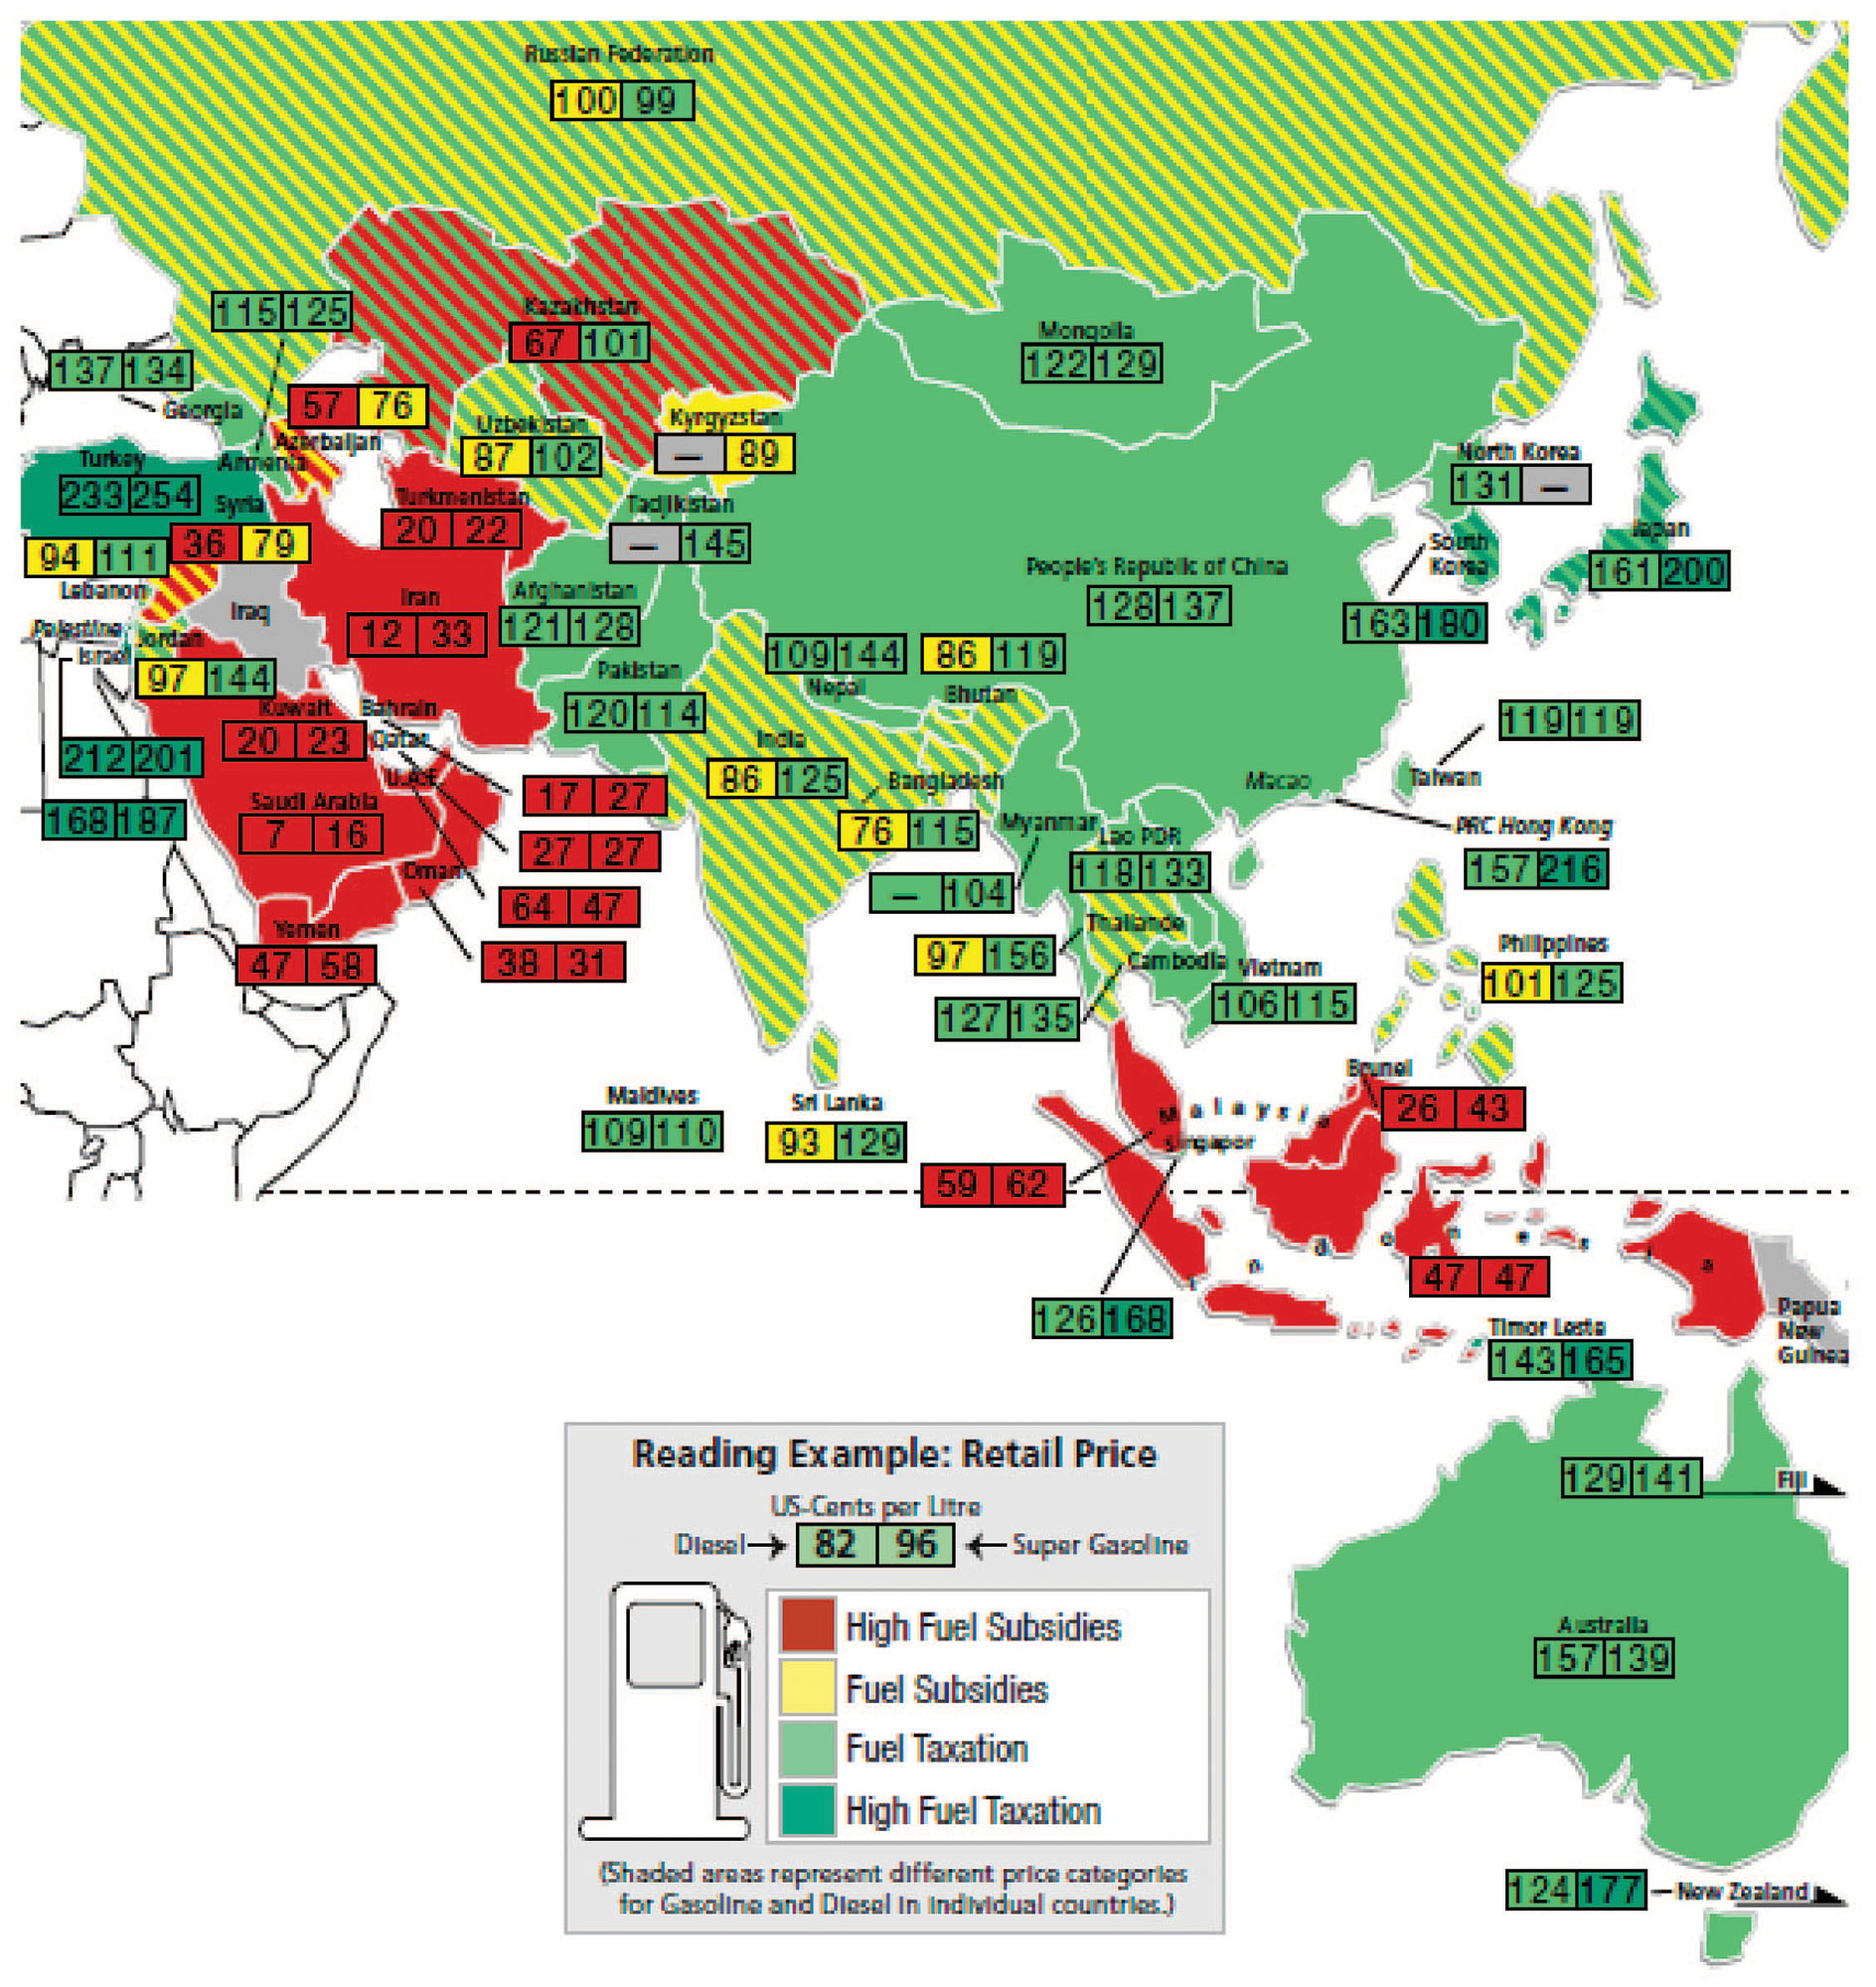
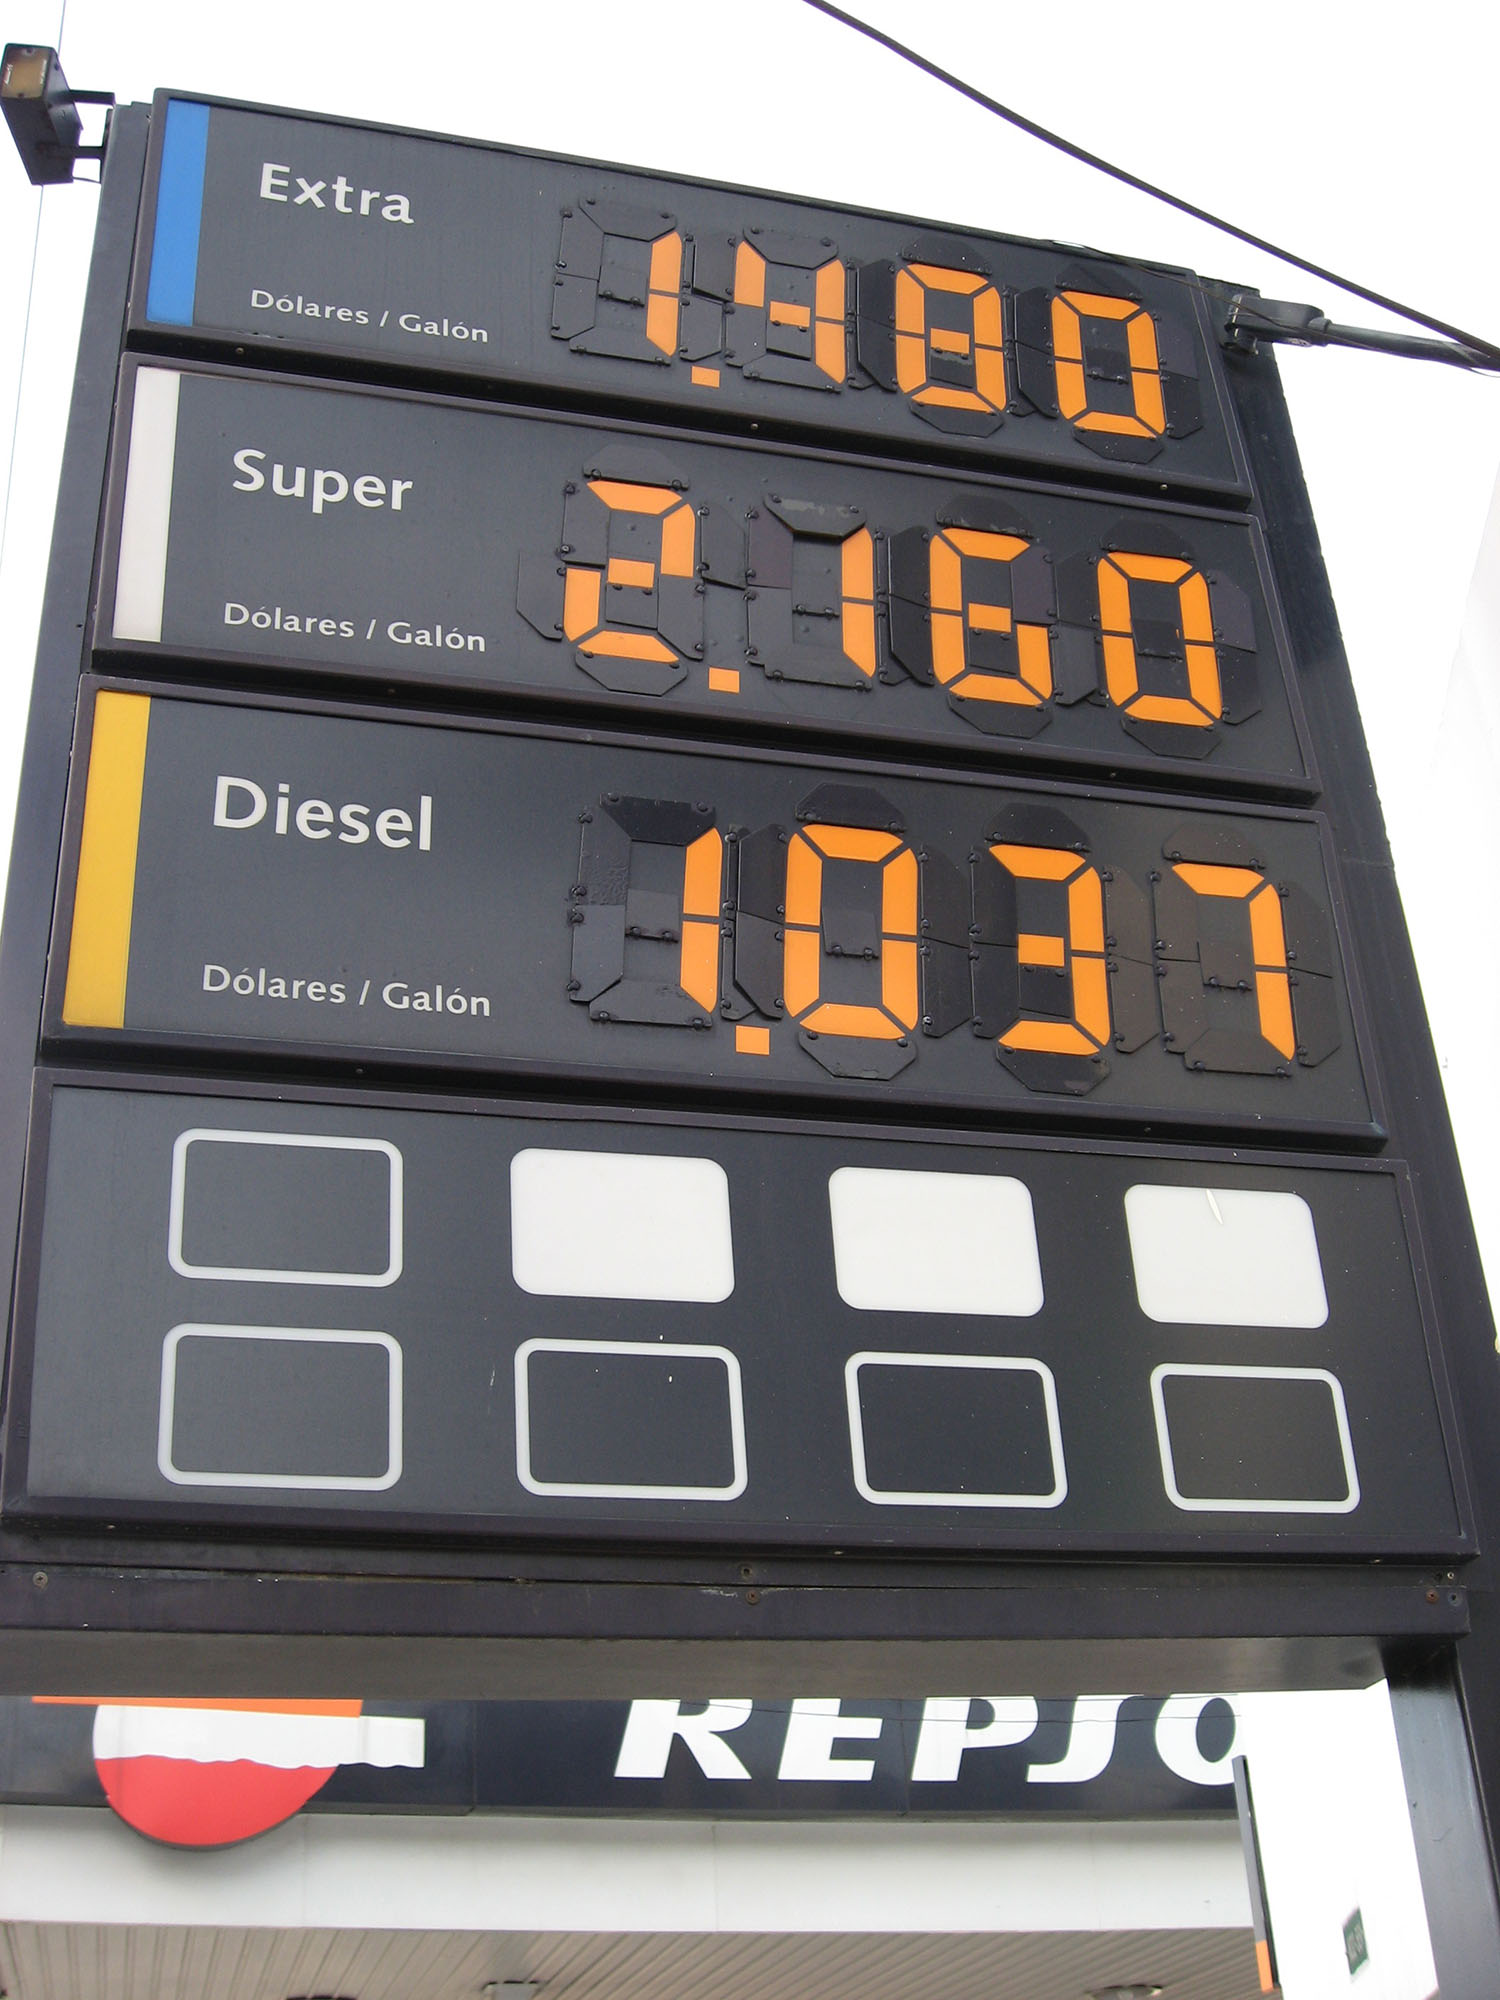
Diesel and electricity are by far the most widely available fuels. Low-sulfur diesel is available in a growing number of countries, but its availability is still fairly limited in developing countries. Current price levels in different countries are well documented through the GIZ International Fuel Prices publication (Wagner et al., 2012/2013). As evidenced in Figure 20.37, subsidy and tax levels can make a significant difference in actual fuel costs.
Natural gas as a bus fuel requires a supply network in close proximity to fleet maintenance and parking areas. Some cities have natural gas and others do not. Some cities have the gas, but have not yet invested in the specialized equipment such as the pipeline, compressors, dehumidifiers, and other equipment necessary to make the fuel usable as a bus fuel. When Delhi, India, was forced to switch to natural gas, the lack of sufficient sources of supply led to severe disruption of bus services. TransJakarta also faced a similar problem where buses would have to queue in long lines due to the lack of refueling stations. These problems can be mitigated with proper planning.
Hydrogen fuel cells are currently not commercially viable without massive subsidies, but an additional problem is the availability of hydrogen. Hydrogen is not found in any substantial quantities in the natural environment. For this reason, hydrogen is not really a fuel type, but rather it is an energy carrier, in a similar manner that an electric battery is an energy carrier. Most of the hydrogen fuel-cell projects developed to date have relied upon electrolysis, which generates the hydrogen from passing an electrical current through water. This requires special equipment and electricity. The other likely source of hydrogen is natural gas, which then requires a natural-gas supply. Both approaches require expensive specialized equipment. Further, depending on how the electricity is generated to produce the hydrogen, the life-cycle emissions from a fuel-cell vehicle can actually be considerably higher than a standard diesel vehicle.
The electricity for electric trolleybuses is less of a problem than the cost and maintenance of the electric conduit and the electricity stations that feed them. Electric-diesel hybrids which do not require electric conduits mitigate the need for expensive conduits.
In every case, a vulnerability and risk analysis associated with fuel-supply systems is necessary, as public services like transportation cannot risk interruptions in operation due to problems within gas pipes tubes or power outages.
The risk of future fuel-price volatility is a related issue. System operators will want to insulate themselves against the risk of sudden future increases in fuel prices. A vehicle technology should be selected which reduces the risk of future fuel price increases.
While predicting future fuel supplies is difficult, this risk can be mitigated by having the vehicle operator negotiate long-term fixed-rate contracts with the relevant fuel suppliers, or by buying futures options in the fuel. The risk can also be mitigated by the use of vehicle technologies that can run on multiple fuel types.
If a city has a nearby natural gas supply, it may be worth the investment in the necessary infrastructure and equipment to provide natural gas at the depot, if a reasonably priced long-term supply contract can be negotiated with the gas supplier. A local supply of natural gas is important because it is relatively easy to pipe but expensive to ship. Similarly, if oil is produced in the country, particularly if it is produced by a state-run oil company, it may be possible to negotiate a long-term fixed-rate supply contract.
Conversely, if a country has hydroelectric power, or large supplies of coal, or declining electricity demand (as in the case of the former socialist countries of Central and Eastern Europe and the former Soviet Union) it may be that future electricity supplies are more predictable than prices for diesel or natural gas. Again, the issue may be more whether or not a long-term supply contract can be negotiated. It is not enough to assume that a government company will mean stable future fuel prices. System operators should still protect themselves with long-term supply contracts or futures contracts. Long-term supply contracts also may be possible from commercial providers, though they will cost more.
In the case of Quito, for example, the decision to go with electric trolleybuses was initially related to low electricity costs. While the initially low electricity rates made the operational costs competitive with diesel-based systems, a subsequent deregulation of the Ecuadorian electricity sector has seen electricity costs increase.
20.5.5Reliability
Reliability of the propulsion technology is a major concern for a BRT system. Vehicle breakdowns in a BRT system are more serious than in a normal bus operation, because a broken down bus will congest the BRT lane and lead to a significant disruption of service.
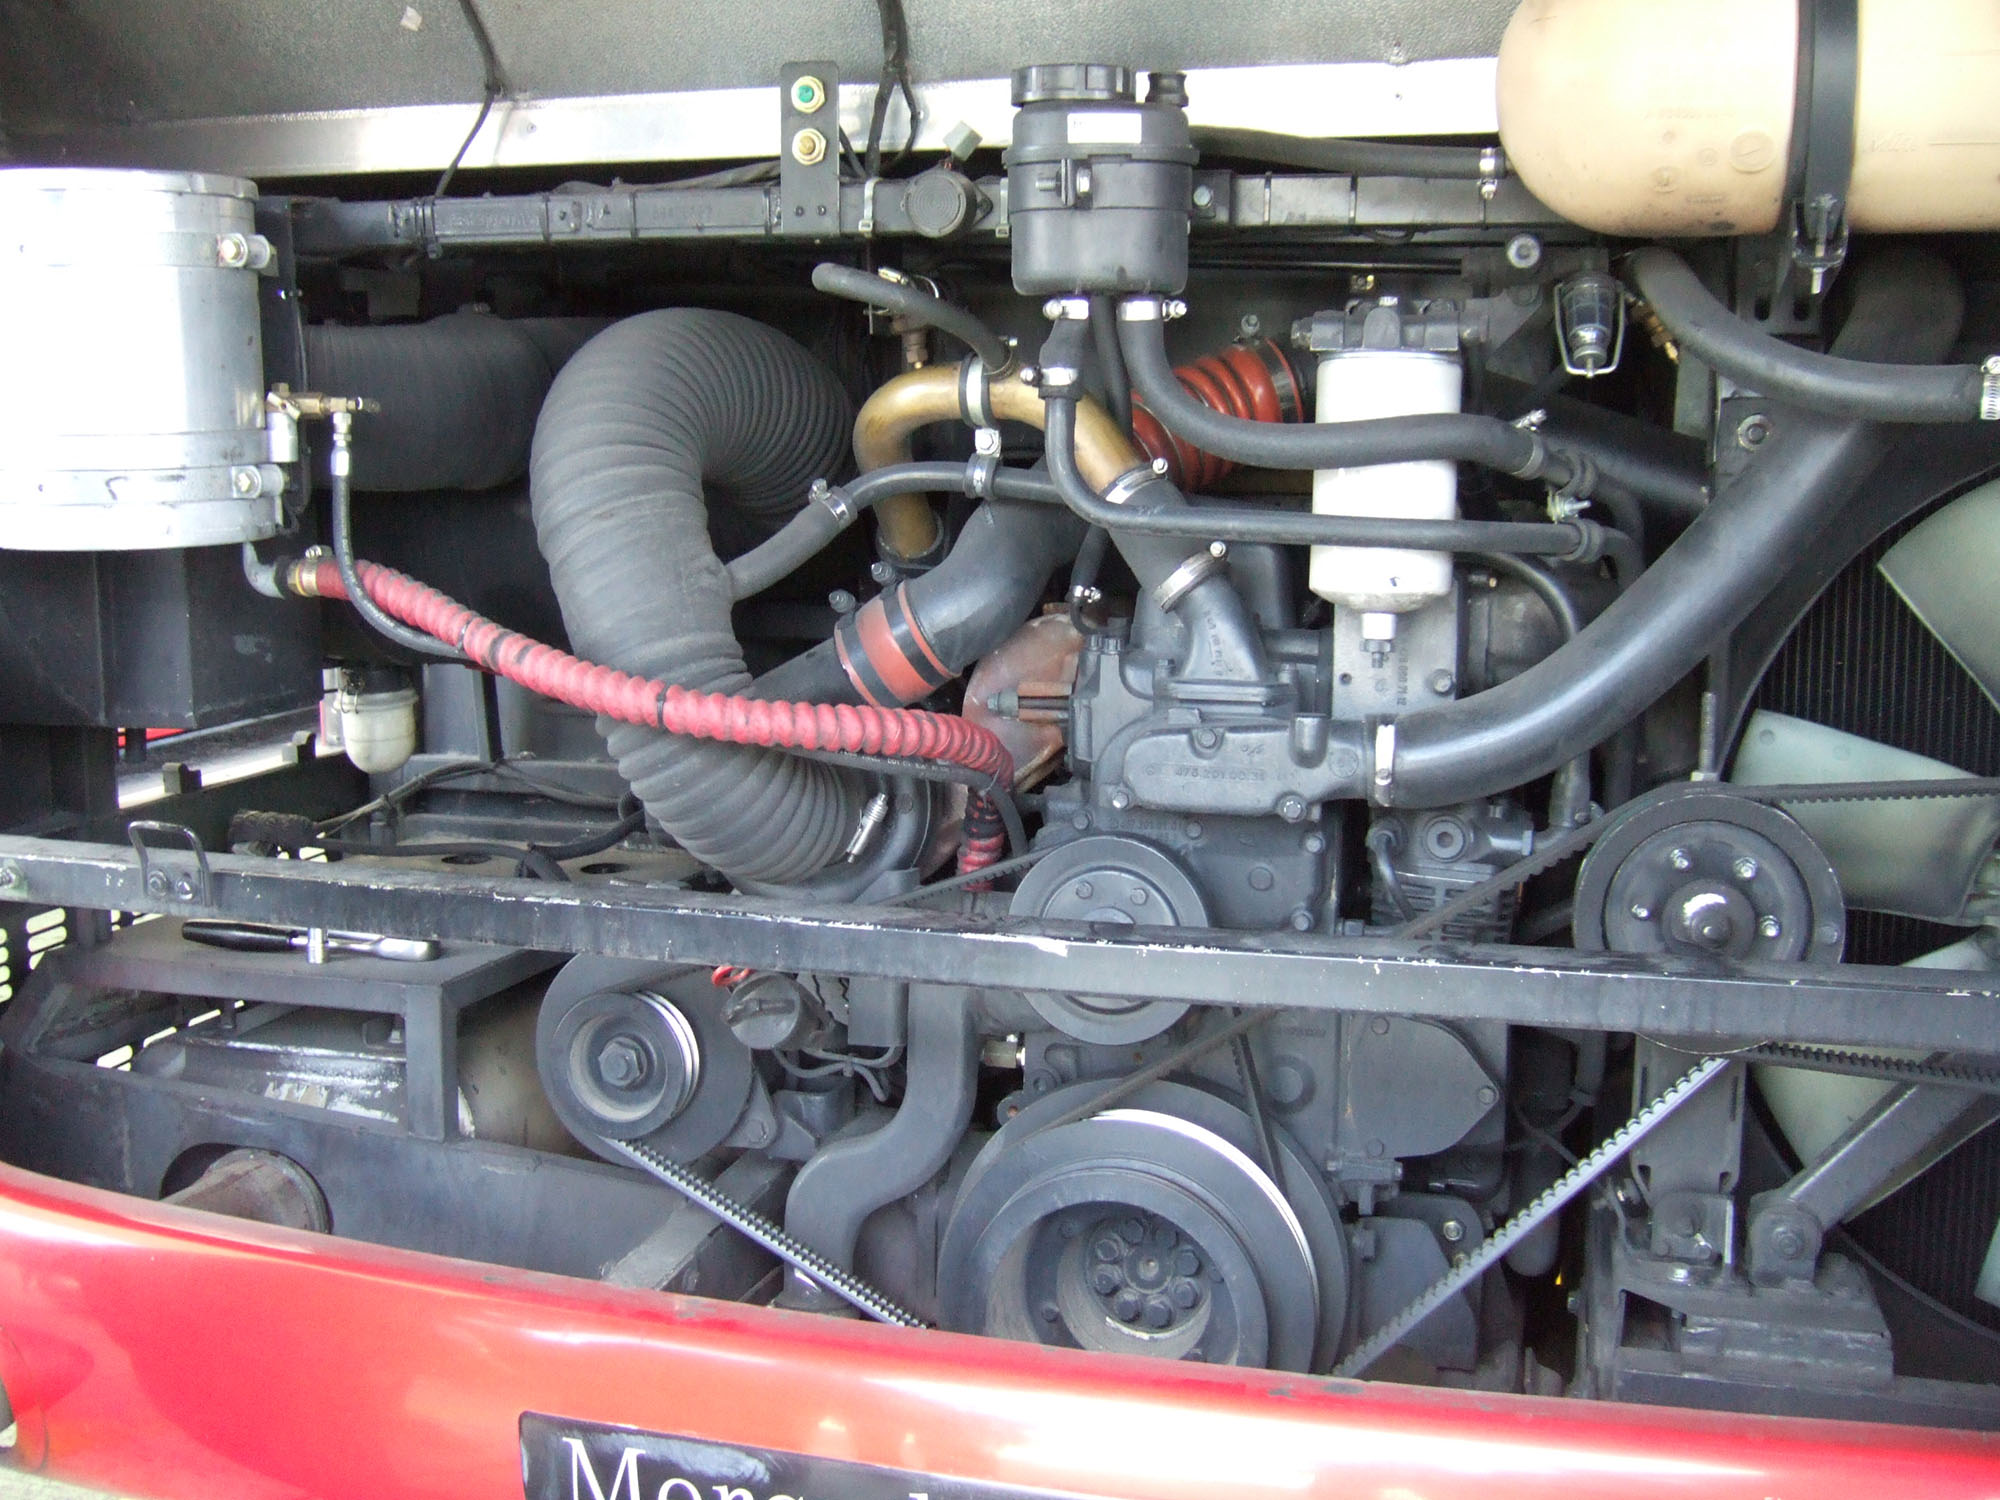
One of the main advantages of diesel fuel is that the vehicle technology is more mature, and with proper maintenance, vehicle breakdowns are more predictable and easier to repair (Figure 20.39).
Electric trolleybuses themselves have excellent maintenance records, but there can be problems with power failures and maintenance failures in the electric conduits. Electric trolleybus technology is used in São Paulo’s Corredor Metropolitano ABD BRT system in São Paulo. Some operational problems were experienced due to poor maintenance of the overhead conduit line, but it could be partially controlled by turning over control of conduit maintenance to the vehicle operator, who has a bigger stake in a breakdown than the power company.
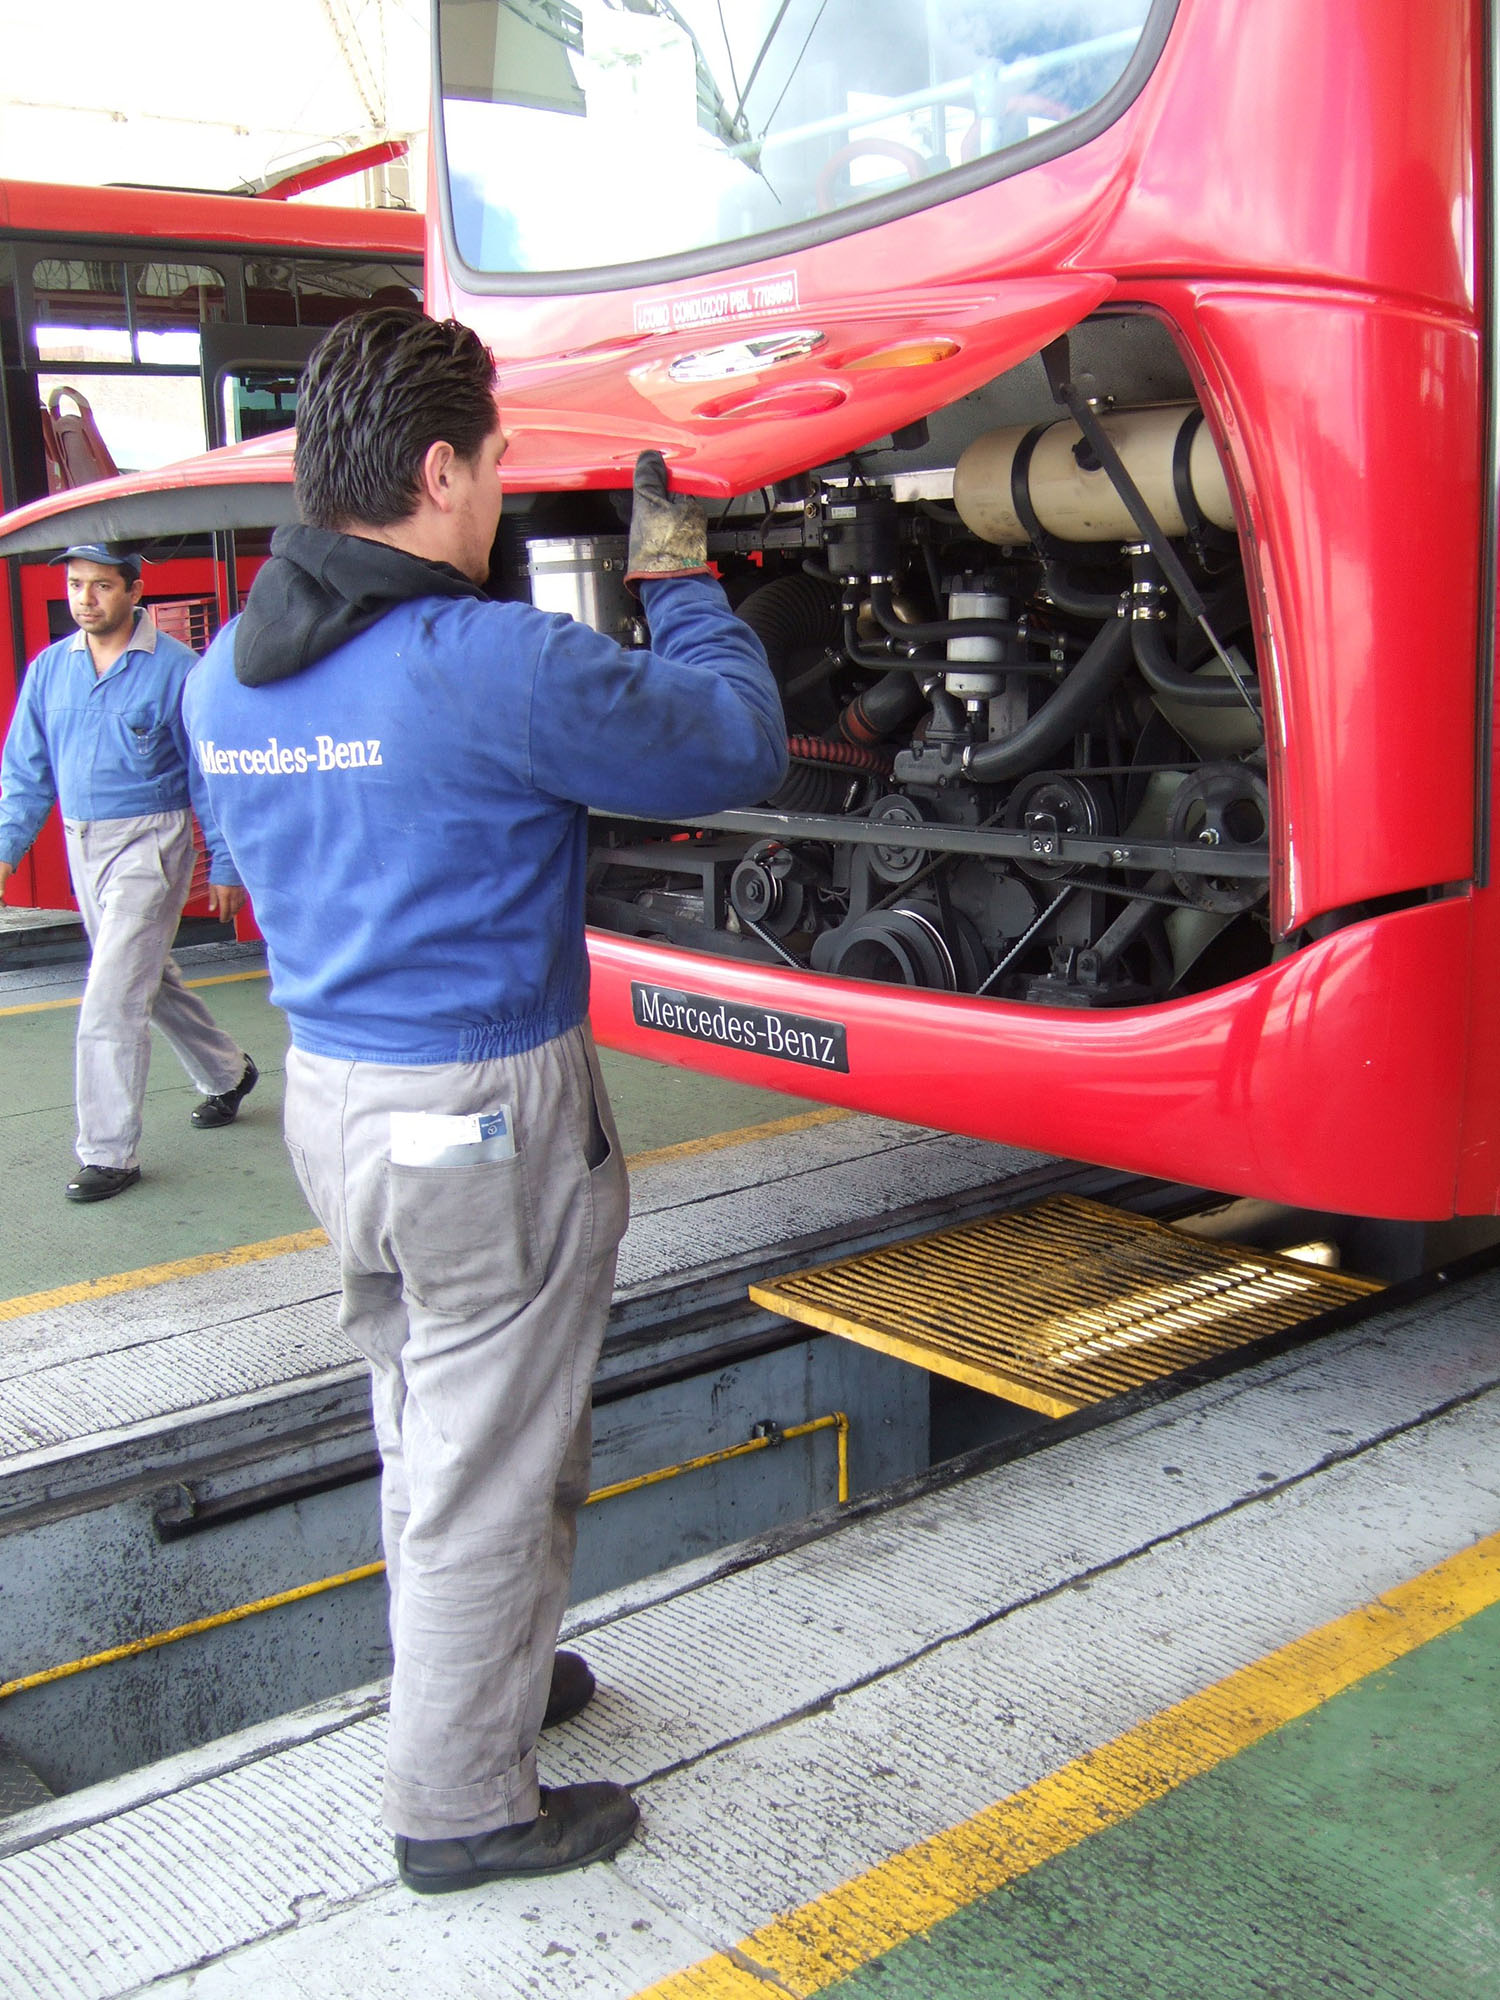
In any case, most important is a maintenance contract with the supplier. In the case of TransMilenio in Bogotá, manufacturers have staff at the depot for major repairs (Figure 20.40). It is therefore critical that the degree of technical support offered by the vehicle supplier be a major consideration in the procurement contract. In Quito, for example, Spanish electric trolleybus suppliers were selected over lower-cost Russian suppliers, largely because of the quality of maintenance support offered.
If the risks of vehicle breakdown are extremely high, local maintenance capacity is low, and the ability of the local operators to mobilize capital is weak, it may be worth exploring the option of leasing the vehicles from the manufacturer.
For any vehicle, it is also advisable to run fuel and general-performance tests locally that simulate the anticipated conditions of operation, before reaching a decision. Vehicles that work well in developed countries in temperate climates may work poorly in tropical climates on poor roads with major drainage problems.
20.5.6Noise
Acceptable noise levels should also be specified within the vehicle-procurement specifications. Excessively loud vehicles are both a health hazard and a detriment to the marketing image of the public transport service.
Noise levels are determined by several variables including:
- Fuel and propulsion system technology;
- Design of propulsion system;
- Size of vehicle relative to engine size;
- Dampening technologies and exhaust system employed;
- Quality of road surface; and
- Maintenance practices.
Some fuel and propulsion systems, such as electric vehicles, are naturally quiet. In other instances, the design of the propulsion system can encourage smooth operation, as well as the dampening of sounds. Ensuring incentives for well-maintained vehicles and roads will also help achieve lower noise levels. In Bogotá, the vehicle specifications mandate that internal noise levels of the vehicles are not to exceed 90 decibels.
A very quiet vehicle does introduce other issues. Electric-trolleybus technology operates with little noise. However, in turn, the lack of noise can create a hazard for pedestrians who may not be aware of the presence of an oncoming vehicle. This type of hazard is particularly a concern for the sight-impaired, who are often quite dependent on noise to guide their movements.
20.5.7Ventilation and Temperature Standards
The presence or absence of climate control inside the vehicles can have an enormous impact, not only on the quality of service, but also on the costs of operations. In some climate conditions, air conditioning is not that critical to customer comfort, but in other cases, the lack of air conditioning alone may be enough to induce middle- and upper-income customers to stay in cars. Requiring air conditioning is critical to a high status image for the system, but it will also put upward pressure on the fare, because vehicles will be more expensive and will use more fuel. As a general rule, climate control inside the vehicles is preferred, if it is at all possible, given the profitability of the system.
Whether air conditioning is used or not, attention should be given to the amount of air turnover inside the vehicle. In highly crowded vehicles, the air quality can quickly deteriorate without adequate ventilation.