20.10Vehicle Costs
The cost of a thing is the amount of what I will call life which is required to be exchanged for it, immediately or in the long run.Henry David Thoreau, author, 1817–1862
The one variable that often has an overriding impact on vehicle selection is cost. The amortization of the vehicle is one of the principal operating costs that affects both operator profitability as well as the fare level. An exorbitantly high-cost vehicle will reduce system profits and make fares unaffordable. For this reason, attention to vehicle costing must be undertaken jointly with the operational costing model.
Some of the principal determinants of a vehicle’s cost are vehicle size (i.e., length) and the type of propulsion system. Other factors, such as interior design, engine size (including if it is a front or rear engine), type of chassis (including high or low floor), air conditioning, and number of doorways, will also play a role. For example, a low-floor vehicle will cost approximately 25 percent more than a higher-floor model.
Economies-of-scale in production is a major factor that affects pricing. For this reason, two 12-meter vehicles often cost less than a single 18-meter vehicle. This result occurs due to the significantly greater number of 12-meter vehicles produced in the world.
Because vehicle cost is not fixed, but a function of the scale of production, some cleaner, new technologies face initial high costs, which create a barrier to entry. However, cleaner vehicles also yield social benefits for beyond just public-transport customers. These factors may in some cases constitute a justification for short-term subsidization of cleaner bus technologies.
Standard diesel vehicles are by far the least expensive vehicle technology. Most new BRT systems, such as the ones in Rio de Janeiro and Belo Horizonte, Brazil, Guadalajara, Mexico, Istanbul, Guatemala City, are now using Euro V diesel technology. Clean diesel technology, in combination with good-quality fuel, can often meet or even exceed the emission standards of supposedly more sophisticated propulsion systems. In Johannesburg, the BRT system was used to introduce Euro V buses for the first time to the country.
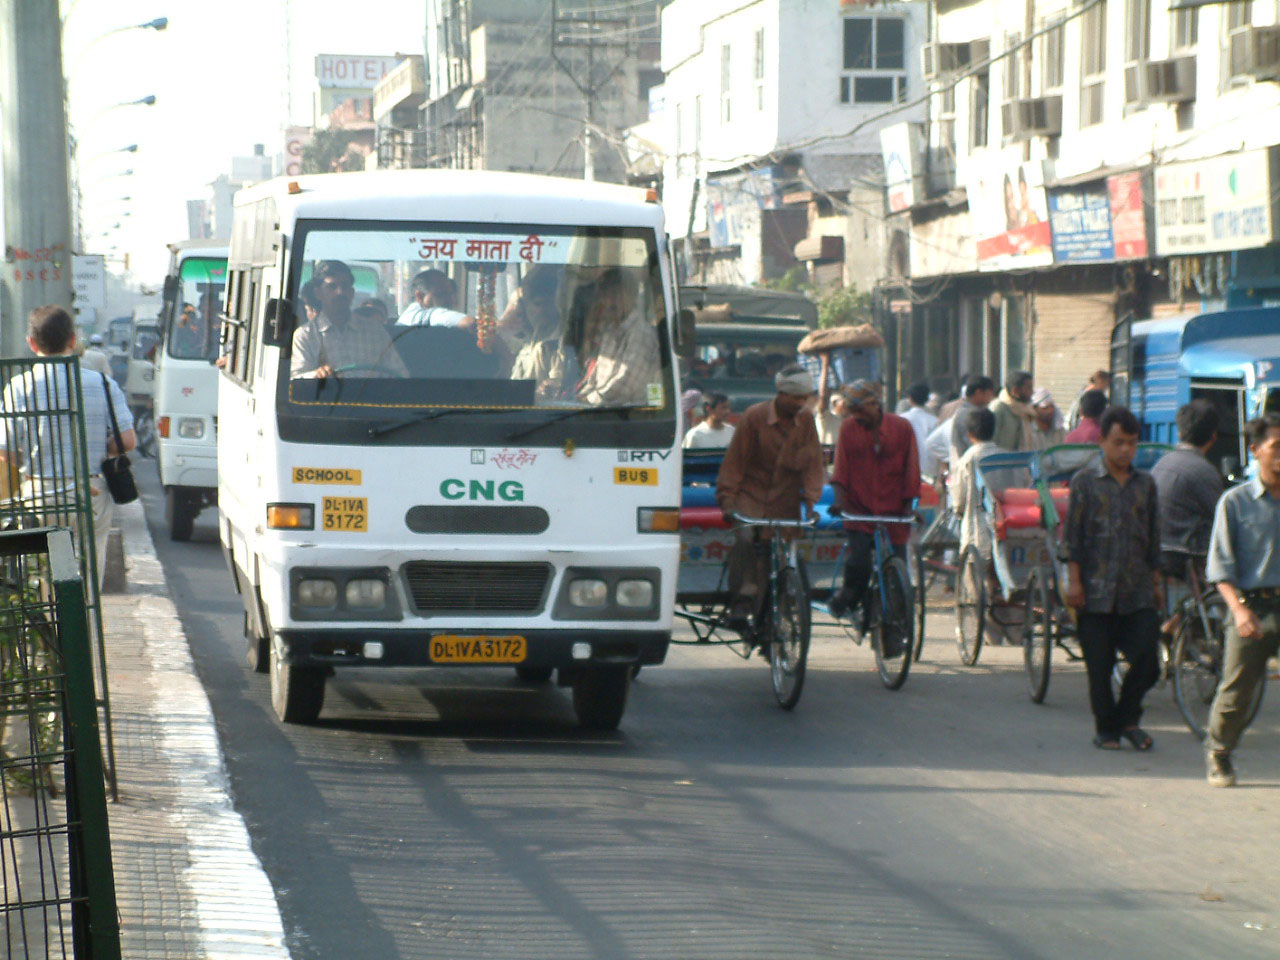
After diesel, CNG is perhaps the next most common type of fuel used in road-based public transport today. In India, the capital cost of a CNG bus is about 20 percent higher than that of a diesel bus, and ongoing maintenance costs are about 10 percent higher. The fuel price is another factor that would also increase the cost of running CNG. A typical 900-millimeter, 12-meter AC diesel bus would cost somewhere between US$65,000 and US$85,000 in India. (Figure 20.45). Elsewhere, a CNG vehicle will increase the procurement price by between US$25,000 and US$50,000 US dollars. The cost difference varies widely, depending on how powerful the engine needs to be, which will be a function of vehicle size.
The electric trolleybus is also a fairly common propulsion type. Electric trolleybuses can be three times the cost of a comparable Euro II diesel vehicle. Further, the added infrastructure costs of the electric conduit and transformers can be significant. These extra costs are somewhat mitigated by the longer life of electric trolleybuses. Due to the lower mechanical demands on the electric trolleybus technology, the life of the vehicles can be twice that of diesel vehicles. Usually electric trolleybuses also have a backup diesel motor in case of a power failure, which accounts for part of the difference in cost.
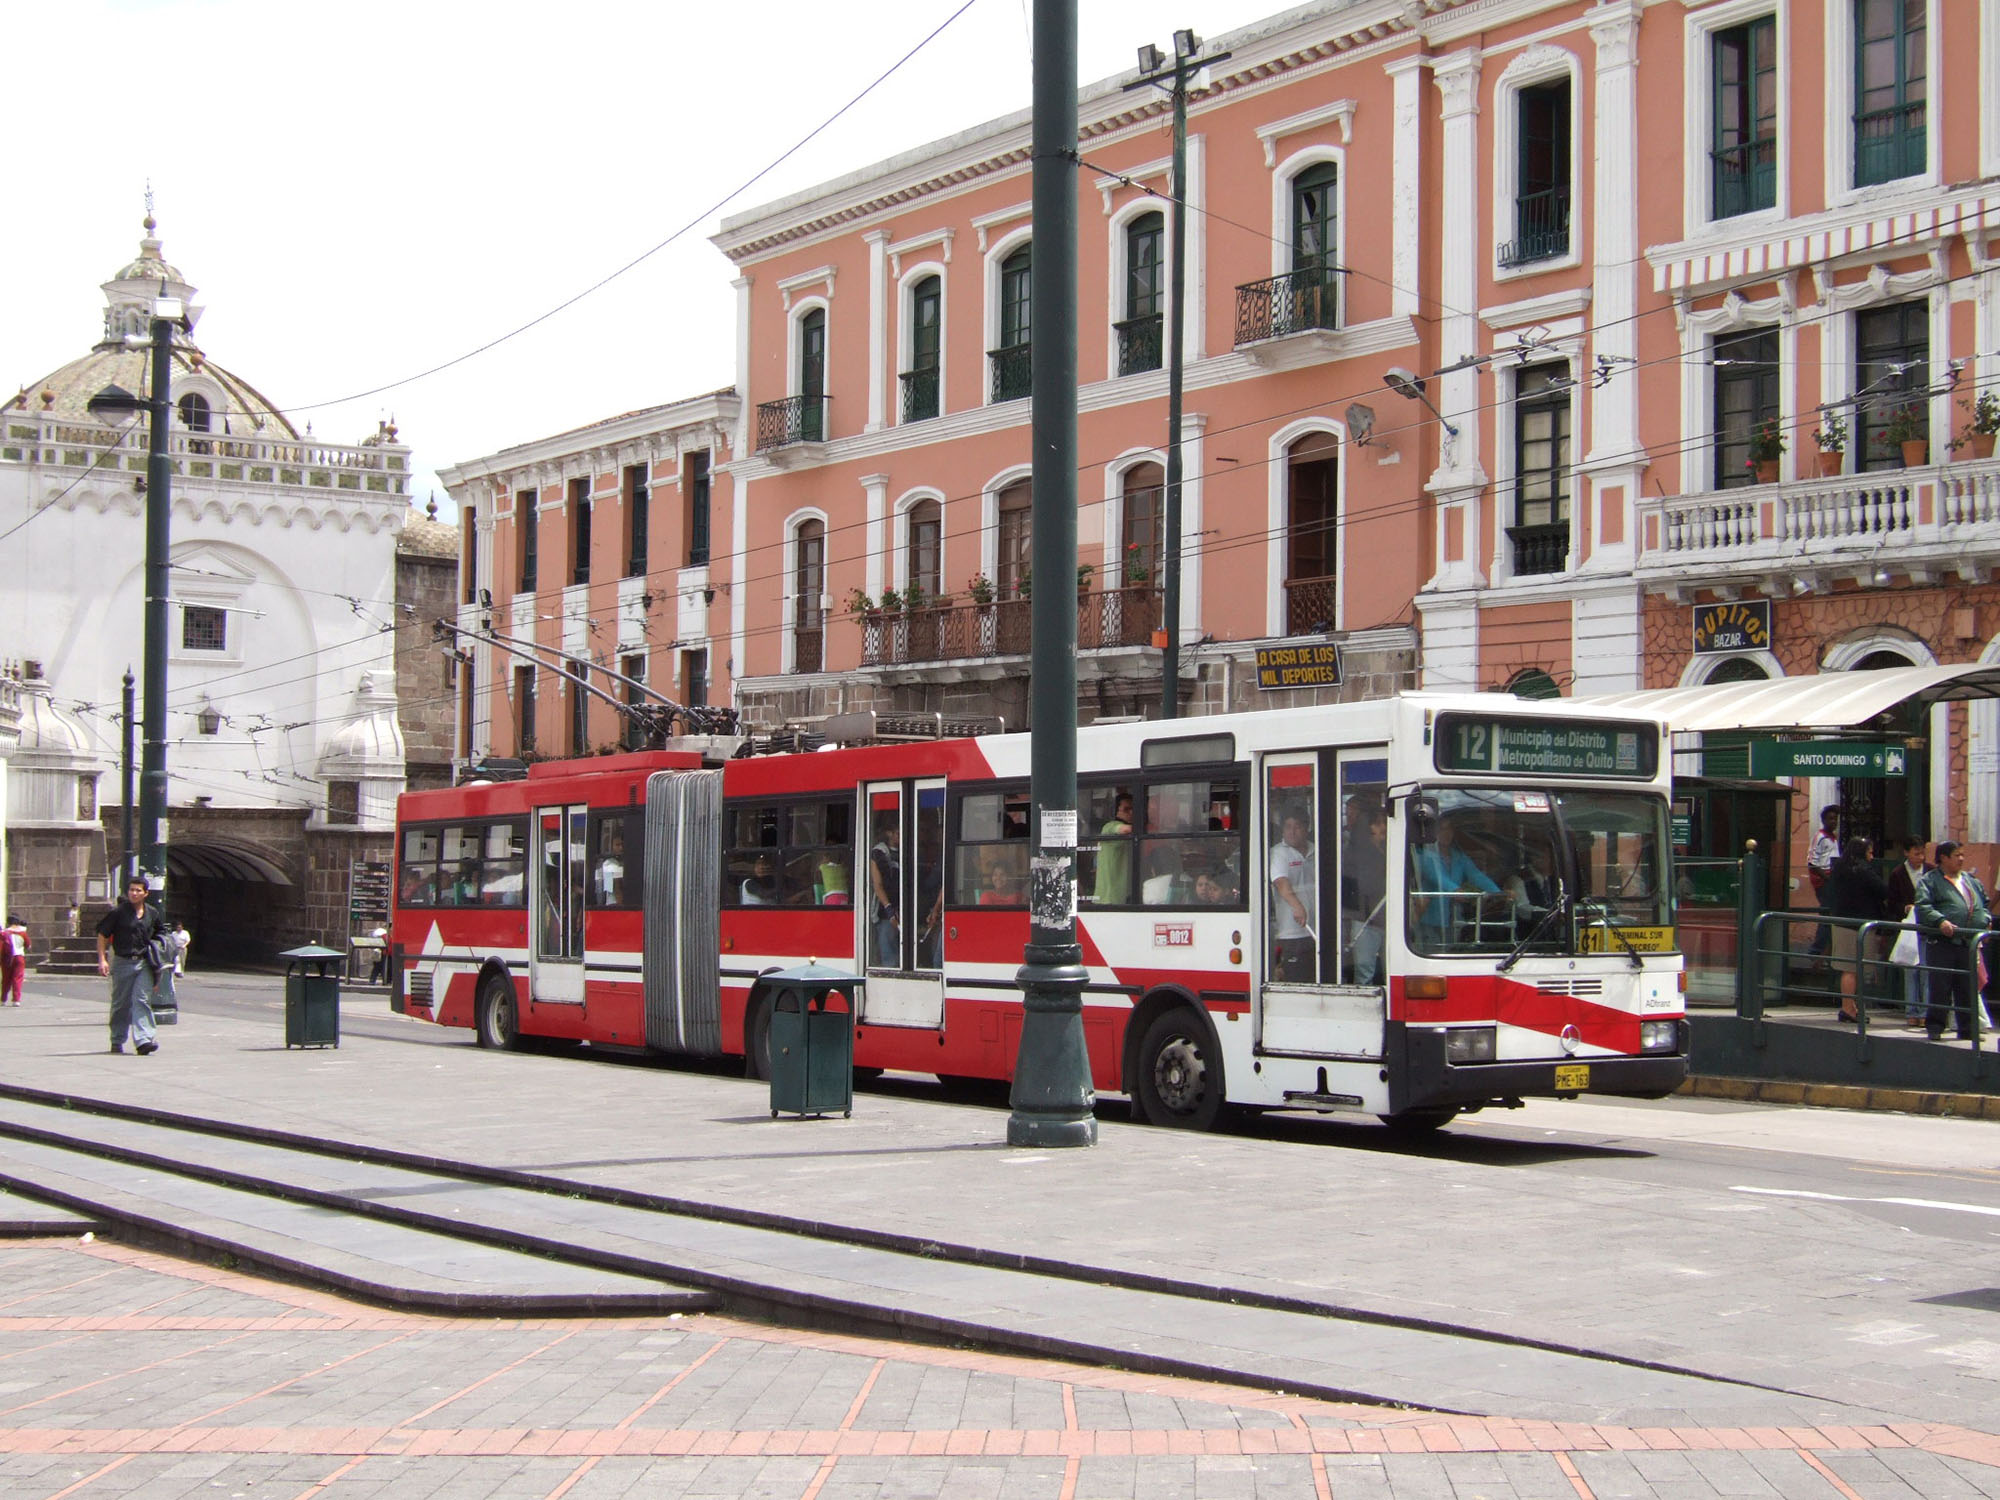
Quito utilized electric trolleybus technology on its first BRT corridor in 1996 (Figure 20.46). The technology was chosen primarily for its environmental benefits. Quito’s historical core is a World Heritage Site, and the municipality wished to reduce the impacts of diesel emissions on the integrity of the built environment. Further, Ecuador’s electricity generation is primarily from hydro-electric sources. The price of each vehicle was approximately US$700,000. In total, the added infrastructure for the electric-trolley corridor pushed capital costs to over US$5 million per kilometer. By comparison, a subsequent BRT corridor in Quito using Euro II diesel technology resulted in capital costs of approximately US$585,000 per kilometer.
Electric-diesel and electric-CNG hybrids are likely to be the next generation of clean vehicle technology. Currently electric-CNG and electric-diesel hybrids are available at US$100,000 to US$175,000 more than a standard diesel bus. The BRT systems in Cleveland, Ohio, and Eugene, Oregon, USA, both use electric-diesel hybrid articulated vehicles with a low floor.
The BRT business plan outlined in the chapters in Volume IV will determine how much money can reasonably be spent on the vehicle procurement without compromising the financial viability of the entire BRT system. The business plan will indicate the maximum cost of the vehicle procurement (depreciation) and the maximum ongoing operating cost (including maintenance) that can be sustained, and how much the system will have to charge per vehicle-kilometer in order to cover these costs. The technical specification can require high levels of environmental protection, high noise standards, high aesthetic standards, and high levels of customer comfort, but only within the parameters that the business plan has determined to be financially viable. In some cases, the system being designed will be profitable, as in the case of TransMilenio Phases 1-3, giving the system designers considerable freedom to set a high technical standard. In other cases, such as in very poor countries, customer demand may be highly sensitive to even modest increases in fare prices, placing tight constraints on the options for the technical specification.
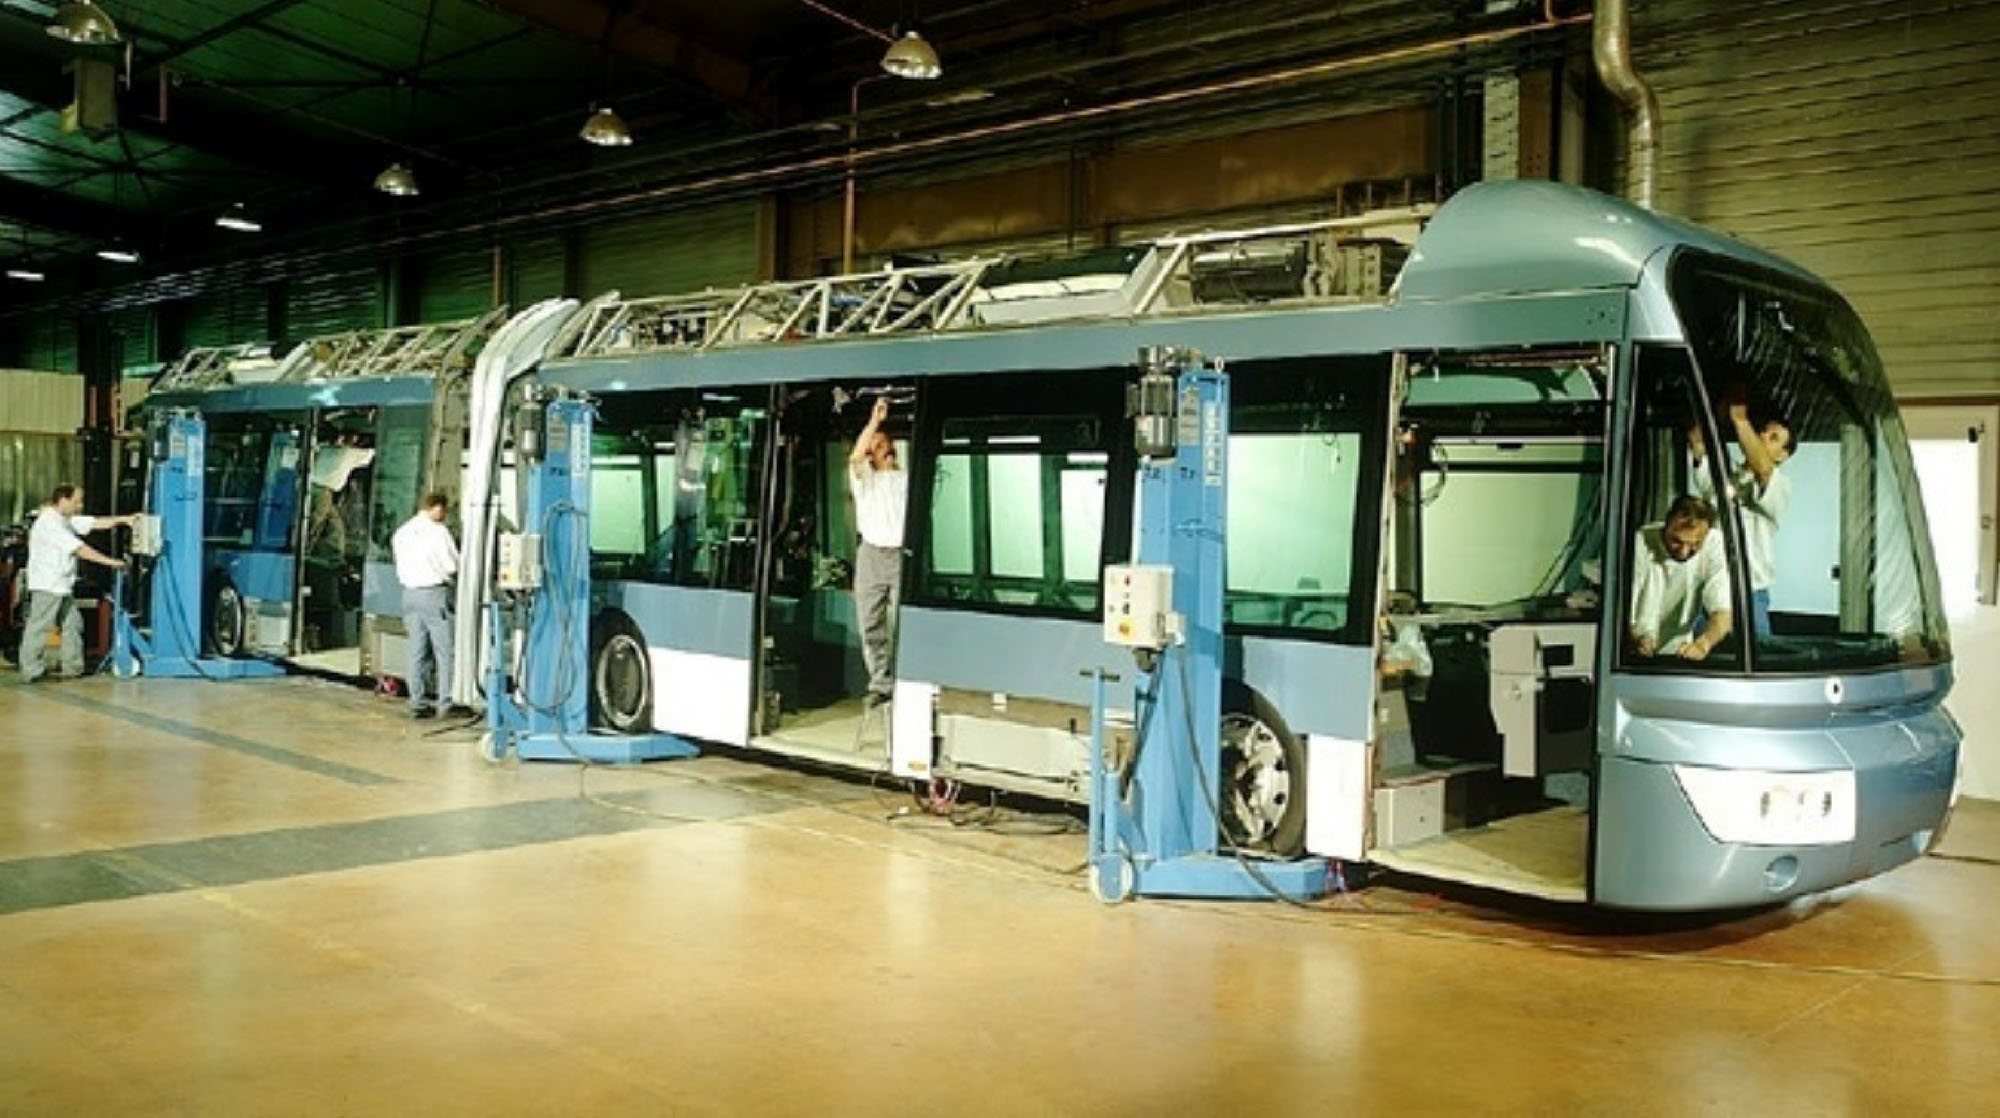
Many local conditions will influence the cost of the vehicle. Vehicle technologies with a longer history and large manufacturing volumes will hold a cost advantage in terms of manufacturing economies of scale. Many traditional Indian buses, for example, are mass-produced using a truck body, and are some of the lowest-cost buses in the world, but they leave much to be desired from the point-of-view of customer comfort. New vehicle technologies will generally have lower manufacturing volumes and may incur additional research and tooling costs (Figure 20.47).
The location of the manufactured vehicle will also be a factor. Production sites in developing countries will often hold an advantage in terms of labor and site costs. Further, locally manufactured vehicles will have lower shipping costs to arrive at the destination city. However, in some instances, locally manufactured vehicles may raise quality issues in comparison to developed-nation production sites.
In some cases, the vehicle manufacturers themselves have determined that certain branches of their own company are responsible for specific regions, even though they may not be the lowest-cost producers. For example, the cost of good-quality name- brand buses in Africa is sometimes more expensive, only because the manufacturers have determined that the African market is to be supplied by the European branch, rather than the Latin American or Asian branch of the company. The following factors are likely to strongly influence local vehicles procurement costs:
- Chassis cost;
- Body Cost;
- Sales tax;
- Licensing and paperwork fees and costs;
- Circulation permit costs;
- Operational insurance costs;
- Financing cost;
- Projected vehicle life;
- Projected resale value;
- Projected repair requirements.
For imported vehicles, there will be the following additional cost considerations:
- CIF costs;
- Shipping costs;
- Shipping insurance costs;
- Local port storage fees;
- Tariffs;
- Value-added tax;
- Local customizing costs;
- Domestic transportation costs from ports to cities.
Table 20.10 breaks down how different elements that go into choosing the best type of vehicle for a public-transport system affect the overall vehicle price.
Table 20.10Cost of each vehicle element as a percentage of impact to total vehicle cost
| Percent of Total Vehicle Price | Costs as a Percent Additional to Total Vehicle Price | ||||
|---|---|---|---|---|---|
| Passenger Capacity (type of vehicle) | Chassis | Body | Total | Low Floor | Air Conditioning |
| 40 (mini) | 50% | 50% | 100% | 4.5 | 12.5 |
| 53 (midi) | 50% | 50% | 100% | 4.25 | 12 |
| 75 (conventional) | 55% | 45% | 100% | 4 | 11.5 |
| 120 (articulated) | 60% | 40% | 100% | 2 | 11.5 |
Table 20.11 provides a summary of vehicle-cost estimation based on technology types and location of manufacturer. However, these costs could be significantly underestimated, particularly in the case of Africa, which has limited proximate vehicle-manufacturing capability, high financing costs, and high duties and value-added taxes.
Table 20.11Vehicle costs for standard 12 meter bus
| Vehicle type | Purchase cost (US$) | Percentage |
|---|---|---|
| Diesel | Baseline range of $200,000 to $600,000; depends on where the vehicle is manufactured and if it is high-floor or low-floor | - |
| CNG, LPG buses | $20,000 to $150,000 more than a comparable standard diesel bus | 5-50% more than diesel |
| Hybrid-electric buses | $100,000 to $220,000 more than a comparable standard diesel bus | 33-72% more than diesel |
| Fuel-cell buses | $800,000+ more than a comparable standard diesel bus | 400+% more than diesel |
Sources: Adapted from IEA, 2002, p. 200; EESI; NBRTI; FTA; EMBARQ; BYD Brazil; and publictransport.about.com
Determining an aggregate cost might be difficult, considering there are several determining factors involved. However, it is advisable for BRT project managers to communicate with local vehicle manufacturers throughout the process, as this will allow for a comparison of all price options pertinent to vehicle choice.
In practical terms, a joint work effort will be required between system operational design and the business plan. An iterative process will help to find an optimal vehicle technology solution that both meets a high-level of customer comfort as well as achieves cost-effectiveness.