2.2Costs
While real trolleys in Newark, Philadelphia, Pittsburgh, and Boston languish for lack of patronage and government support, millions of people flock to Disneyland to ride fake trains that don’t go anywhere.Kenneth T. Jackson, historian, 1939–
2.2.1Capital Costs
On the same corridor, with the same type of right-of-way (elevated, underground, or on the street in a dedicated lane), many of the costs of BRT, LRT, and HRT will be similar. HRT systems by definition cannot operate on normal streets but require a grade-separated right-of-way. This generally requires expensive tunneling or the construction of elevated rights-of-way and stations. Full grade separation brings significant time savings benefits (as all traffic congestion and intersection delays are eliminated), but also significantly increases construction costs and maintenance costs, regardless of whether the vehicles operating on elevated or underground structures are buses, heavy rail vehicles, or light-rail vehicles.
In the past, many HRT systems were built using less expensive “cut and cover” construction methods. Such construction methods were highly disruptive of the surface environment, leading most cities to depend on deep boring techniques that allow the surface to remain intact but are much more expensive. Another reason that HRT systems tend to be much more expensive than street-level LRT or BRT options is because the elevated or underground stations and their access and egress, as well as the wider turning radii required by the vehicles and the large area generally required for the rail depot, make more land acquisition necessary than BRT or LRT alternatives. The costs of tunneling and elevating the HRT system are not only related to tunneling or elevating the right-of-way. Even costlier is elevating or excavating for each station, which is likely to cost around US$100 million per station. Most elevated or underground heavy rapid transit systems minimize the number of stations to increase speeds and keep the costs down, but this frequently limits accessibility to the system. It is fairly typical for modern HRT systems to have stations 1 kilometer apart, whereas it is generally recommended (see Chapter 6: Service Planning) that high-capacity public transport stations be placed around .450 to 500 meters apart to minimize walking access times. Were stations located in optimal locations, the cost of HRT alternatives would be significantly increased. LRT and BRT both have significantly lower capital costs in relation to HRT primarily because they can be located on normal city streets.
In general, the most significant capital cost differences between an LRT and a BRT are due to the following:
- LRT requires rails and switches, and the roadbed to support them;
- LRT requires electric catenary to conduct electricity to the vehicle safely;
- LRT requires rail vehicles;
- LRT requires a special depot connected to the system by rail tracks.
From a sample of five LRT projects in the United States, the average cost per kilometer of the light-rail track was US$38.6 million a kilometer, though the range was wide, from US$17.0 million to US$66.9 million.
A reasonable estimate of the cost of an LRT vehicle is US$3.6 million in the United States (http://onlinepubs.trb.org/onlinepubs/tcrp/tcrp_rpt_165ch-08.pdf, p. 8-1), though the range is from US$1.9 million to US$4.5 million (http://www.apta.com/resources/aboutpt/Documents/table22_vehvosttransitlength.pdf).
The number of vehicles needed will vary greatly with the passenger demand. Normally, an LRT vehicle will have a capacity of around 150 people, similar to that of an articulated bus. An articulated LRT vehicle can have a capacity of about 240 people, similar to a biarticulated bus (http://onlinepubs.trb.org/onlinepubs/tcrp/tcrp_webdoc_6-c.pdf, pp. 3–60). A decent quality 12-meter bus today can be purchased for as little as US$70,000 in India, but more typically costs about US$250,000 in most of the world and about US$400,000 in the United States. An articulated bus today can be purchased from China for under US$300,000, with US$450,000 being more typical in Latin America, and closer to US$800,000 in the United States. The cost of a biarticulated BRT bus in Latin America today is around US$800,000, and would probably be roughly double this in the United States, but there are few in operation in the United States (http://www.apta.com/resources/aboutpt/Documents/table22_vehvosttransitlength.pdf).
In addition, the LRT vehicles need to have a depot where they can be safely stored and repaired in a location that is connected to the tracks. Both BRT and LRT need depots. The primary capital cost advantage for a BRT depot is that it does not necessarily need to be adjacent to the BRT corridor, but can be anywhere in proximity to the corridor. In addition, a BRT in a higher-income country can probably use an existing bus depot. In most BRT systems in the United States, existing bus depots were used when standard diesel buses utilized the BRT corridor, while for new LRT systems a new yard or depot is generally necessary. For the two LRT systems for which disaggregated data was available, the cost of the LRT depot ranged from US$10.4 million to US$65.7 million.
Table 2.1Average Cost per Kilometer by Mode(BRT, LRT, HRT), Developed Versus Developing Country
| Type | Lower Income Countries (2013 $/Km) | Higher Income Countries (2013 $/Km) |
|---|---|---|
| BRT Average | $11,504,575 | $10,054,824 |
| BRT Gold | $16,312,504 | n.a. |
| BRT Silver | $9,528,467 | $9,729,605 |
| BRT Bronze | $9,612,943 | $10,380,042 |
| LRT | $25,373,992 | $37,496,032 |
| HRT | $87,429,209 | $433,660,969 |
Out of a database of forty-two BRT projects, nineteen LRT projects, and twenty-six HRT projects, the average cost per kilometer in constant 2013 dollars was derived and shown in Table 2.1. The number of data points is limited, and the clarity of this cost data is also limited, so these figures should be taken as very rough indications. The database has taken out LRT and BRT systems that involved elevation or tunneling to make the costs more comparable. For example, the Crenshaw/LAX LRT in Los Angeles, which is partially elevated and partially underground, is projected to cost upward of US$125 million per kilometer. The Boston Waterfront Silver Line busway, which was not long enough to qualify as a “BRT” corridor, cost US$625 million for 1.6 kilometers of exclusive tunnel, or about US$391 per kilometer, of which US$237 million (US$148 million per kilometer) was because of the tunnel under Boston Harbor and the underground stations. The system also used extremely expensive specialized buses (with both diesel and electric trolley propulsion systems) that cost roughly US$1.7 million each (http://www.fta.dot.gov/documents/FINALBOSTONBRTREPORT062507.pdf).
Based on this data, in lower income countries, with all other things being equal, it is reasonable to expect an LRT system (surface only) to cost 1.5 to 2.6 times that of a comparable BRT system. An HRT system could be expected to cost 5 to 9 times as much as a BRT and 3.4 times as much as an LRT. In higher income countries, it is reasonable to expect that a surface LRT alternative is likely to cost 3.6 to 3.9 times that of a BRT alternative. An HRT alternative is likely to cost up to 40 times as much as a BRT alternative, and up to 12 times as much as an LRT alternative.
Curiously, the difference in cost between BRT projects in higher and lower income countries was minimal. To some extent this reflects a higher quality of BRT projects in lower income countries. On average, a Gold Standard BRT in lower income countries costs double that of a Silver Standard or Bronze Standard BRT system. There was no significant difference between the cost of a Bronze Standard and a Silver Standard BRT in either higher or lower income countries, indicating that it is tough political decisions rather than a willingness to spend money that largely distinguished Silver Standard projects from Bronze Standard projects.
The cost of an LRT in higher income countries was 50 percent more than an LRT in lower income countries, and the cost of an HRT project in higher income countries costs five times as much as an HRT project in lower income countries, probably due to the higher cost of labor in construction.
Table 2.2BRT Project Capital Costs by Country and Quality
| Country | City | Project | Length (km) | Cost/Km (2013 USD/km) | Quality (BRT Classification) |
|---|---|---|---|---|---|
| BRT Lower Income Economies | |||||
| Brazil | Belo Horizonte | Cristiano Machado | 7 | $4,040,571 | Gold |
| Brazil | Curitiba | BRT "Linha Verde" | 33.8 | $7,146,213 | Gold |
| Brazil | Rio de Janeiro | TransCarioca | 39 | $14,716,462 | Gold |
| China | Guangzhou | Guangzhou BRT | 22.9 | $7,672,668 | Gold |
| China | Yichang | Yichang BRT | 22.9 | $6,812,169 | Gold |
| Colombia | Bogotá | TransMilenio Phase 1 | 41 | $18,574,652 | Gold |
| Colombia | Bogotá | TransMilenio Phase 2 | 42 | $33,036,852 | Gold |
| Colombia | Bogotá | TransMilenio Phase 3 | 37 | $24,582,229 | Gold |
| Colombia | Medellín | Metroplus | 13 | $30,230,724 | Gold |
| $16,312,504 | Gold Average | ||||
| Brazil | Belo Horizonte | Antônio Carlos-Pedro 1 | 15 | $24,124,667 | Silver |
| Brazil | Rio de Janeiro | TransOeste | 55 | $15,268,816 | Silver |
| China | Lanzhou | Lanzhou BRT | 9 | $7,805,467 | Silver |
| Colombia | Barranquilla | Transmetro | 14 | $19,295,428 | Silver |
| Colombia | Cali | Mio | 49 | $17,046,807 | Silver |
| Colombia | Pereira | Megabús | 27 | $5,326,363 | Silver |
| India | Ahmedabad | Janmarg BRT Phase 1 + 2 | 88 | $3,003,560 | Silver/Bronze |
| Mexico | Chihuahua | Vivebús | 20 | $3,856,908 | [likely Silver] |
| Mexico | León | Optibús Etapa 1 | 25 | $2,678,309 | [likey Silver] |
| Mexico | Estado de Mexico | Mexíbus Línea 1 - Cd Azteca - Tecamac | 16 | $7,861,951 | Silver |
| Mexico | Estado de Mexico | Mexíbus Línea 3 Chimalhuacán - Pantitlán | 15 | $8,934,935 | Silver |
| Meixco | Mexico City | Metrobús Líneas 1-4 | 93 | $6,216,923 | Silver |
| Mexico | Mexico City | Metrobús Línea 5 | 10 | $6,352,388 | Silver |
| Mexico | Monterrey | Ecovía Line 1 | 30 | $4,274,341 | Silver |
| South Africa | Johannesburg | Rea Vaya 1a | 30 | $10,387,801 | Silver |
| $9,495,644 | Silver Average | ||||
| China | Beijing | BRT Line 1 | 79 | $1,064,030 | Bronze |
| India | Indore | Indore iBus BRT | 11 | $4,920,486 | [likely Bronze] |
| India | Pimpri Chinchwad | Primpri Chinchwad BRTS | 45 | $5,482,658 | Bronze |
| India | Surat | Surat BRTS | 11 | $12,461,951 | Bronze |
| Mexico | Puebla | RUTA, Line 1 | 19 | $6,526,254 | Bronze |
| South Africa | Cape Town | MyCiTi Phase IA as of 2010 | 17 | $23,794,946 | Bronze |
| South Afria | Johannesburg | Rea Vaya Phase 1b | 18 | $13,040,278 | Bronze |
| $9,612,943 | Bronze Average | ||||
| India | Delhi | Delhi High Capacity Bus System (HCBS) Pilot | 6 | $3,909,769 | Basic BRT |
| Indonesia | Jakarta | Transjakarta - Line 2 & 3 | 14 | $5,812,720 | Basic BRT |
| Indonesia | Jakarta | Transjakarta - Line 11 | 11 | $3,366,204 | Basic BRT |
| Indonesia | Jakarta | Transjakarta - Line 12 | 24 | $1,429,598 | Basic BRT |
| Brazil | Fortaleza | Avenida Alberto Craveiro | 3 | $5,041,467 | Rating pending |
| Colombia | Cartagena | Transcaribe | 13 | $42,452,618 | Silver pending |
| Colombia | Bucaramanga | Metrolínea | 50 | $6,917,539 | Rating pending |
| Mexico | Puebla | RUTA, Line 2 | 20 | $12,433,272 | Rating pending |
| South Africa | Tshwane | A Re Yeng Phase IA | 7 | $13,834,400 | Rating pending |
| $10,577,510 | Other Average | ||||
| BRT Higher Income Economies | |||||
| France | Paris | TVM Rungis - Croix de Berny RER | 22 | $4,898,500 | Silver |
| France | Rouen | TEOR (Phase 1) | 38 | $5,410,316 | Silver |
| USA | Cleveland, OH | HealthLine | 11 | $18,880,000 | Silver |
| $9,729,605 | Silver Average | ||||
| USA | Eugene, OR | Franklin Corridor (Green Line) | 6 | $4,427,910 | Bronze |
| USA | Los Angeles, CA | Orange Line (Original) | 23 | $16,332,174 | Bronze |
| $10,380,042 | Bronze Average |
Note: Systems referred to as “likely” Gold, Silver, or Bronze means that they have been evaluated but their rating is pending final approval from the technical committee.
Table 2.2 shows the full list of BRT projects and their costs, and their quality as measured by the BRT Standard. Some of the highest scoring elements of the Standard, which account for many of the differences between Silver and Bronze systems, such as turning restrictions across the busways or physical separation of the rights-of-way, are relatively low cost, yet require political will to implement. Most of the costs in Gold Standard BRT systems are related to creating a high-quality station environment.
The range of costs ran from US$1 million per kilometer for a Bronze Standard BRT in China (which had no depots and was low-quality construction) to US$42.4 million in Cartagena (Silver Standard), which experienced significant construction delays that added to the project cost. A major reason for the divergence in cost among BRT projects is the amount of land and property acquisition required to implement the project.
While the construction costs of the first phase of the Bogotá BRT system (which included the complete reconstruction of the roadbed building wall to building wall) totaled approximately US$18.6 million per kilometer, the second phase increased to as much as US$33 million per kilometer for the costliest segment. This increase was in large part due to land and property purchases. The city decided to widen some roadways during Phase II in order to maintain the number of mixed traffic lanes along the BRT corridor. For Phase III, costs came down again to around US$24.6 million per kilometer (“Applicability of Bogotá’s TransMilenio BRT System to the United States.” USDOT: FTA. May 2006 http://www.fta.dot.gov/documents/Bogota_Report_Final_Report_May_2006.pdf).
Table 2.3Table 2.3 LRT Project Capital Costs
| Country | City | Project | Length (km) | Cost/Km (2013 USD/km) |
|---|---|---|---|---|
| LRT Lower Income Economies | ||||
| Algeria | Constantine | Constantine Tram | 8 | $50,000,000 |
| Algeria | Oran | Oran Tramway | 19 | $22,664,211 |
| Brazil | Rio de Janeiro | PPP|Port Maravilha Light Rail | 28 | $16,071,429 |
| China | Shenyang | Shenyang Tram | 60 | $12,900,000 |
| Mexico | Guadalajara | Tren Ligero Linea 3 | 16 | $31,890,625 |
| Morocco | Casablanca | Casablanca Tramway | 31 | $19,354,839 |
| Morocco | Rabat-Salé | Rabat-Salé Tramway | 19 | $24,736,842 |
| Average | $25,373,992 | |||
| LRT Higher Income Economies | ||||
| France | Paris | 14 | $60,714,286 | |
| France | Rouen | 15 | $45,333,333 | |
| France | Besançon | Line 1 Tramway | 15 | $19,278,333 |
| France | Dijon | Line 1+2 Tramway | 19 | $26,634,737 |
| France | Le Havre | Line 1+2 Tramway | 13 | $41,653,077 |
| France | Reims | Line 1 Tramway | 11 | $44,188,182 |
| France | Lyon | Line 4 Tramway | 16 | $19,397,500 |
| USA | Charlotte | LYNX Blue Line | 16 | $31,445,625 |
| USA | Charlotte | LYNX Blue Line Extension | 16 | $66,856,250 |
| USA | Minneapolis | METRO Blue Line | 20 | $45,145,730 |
| USA | Sacramento | RT Blue Line extension | 7 | $32,321,429 |
| USA | Houston | Purple Line/SW Corridor | 10 | $16,983,900 |
| Average | $37,496,032 |
The costs of at-grade LRT systems in countries with both developed and emerging economies, shown in Table 2.3, range from US$19.3 million per kilometer for tramways in France to US$66.9 million for the Charlotte (North Carolina) LRT extension. A few of the LRT systems in the United States were rated using the BRT Standard, and they ranged from Silver to Bronze. There was no clear correlation between the cost of an LRT system and its rating using the BRT Standard.
Table 2.4 contains the range of costs for HRT projects divided into countries with developed and emerging economies. The lowest cost systems are in India, at a minimum of US$51 million per kilometer. Labor costs for construction are very low in India, and these are primarily elevated structures with a limited number of station stops.
Land acquisition costs also tend to be lower in lower income countries than in higher income countries, though this is not always the case. One of the world’s costliest public transport projects to date has been the Jubilee Line extension to the London metro system. The 16-kilometer extension came to a total of US$500 million per kilometer. Much of this high figure was due to the procurement of private land and property in areas such as the Canary Wharf business district.
Another factor is the amount of and depth of other competing infrastructure. The highest cost public transport project ever to be built was the New York Second Avenue Subway, costing an estimated US$982.658 million a kilometer. This project bored under the bedrock on the east side of Manhattan, at a significant depth (98 feet) to avoid an unprecedented density of existing infrastructure. Each station is being done with traditional cut and cover methods, requiring land acquisition in a very high cost land market. A high water table is another factor when estimating construction costs, as construction below the water table adds additional expense.
Table 2.4Table 2.4 HRT Project Capital Costs, Emerging and Developed Economies
| Country | City | Project | Length (km) | Cost/Km (2013 USD/km) |
|---|---|---|---|---|
| HRT Lower Income Economies | ||||
| Brazil | Rio de Janeiro | Line 4 metro | 16 | $233,750,000 |
| Brazil | São Paulo | Line IV metro | 14 | $101,992,857 |
| China | Lanzhou | Lanzhou Metro Line 1 | 34 | $93,176,471 |
| China | Guangzhou | Guangzhou Metro Line 1 | 18.5 | $87,729,730 |
| China | Shenzhen | Shenzhen Metro Line3 | 33 | $56,224,491 |
| China | Guangzhou | Guangzhou Metro Line 2 | 18 | $79,259,480 |
| China | Guangzhou | Guangzhou Metro Line 3 | 36 | $68,288,974 |
| China | Shanghai | Metro Line 2 | 19 | $81,104,400 |
| China | Beijing | Metro Line 4 | 29 | $88,750,707 |
| Colombia | Medellín | Tranvía de ayacucho | 4 | $81,149,750 |
| Colombia | Bogotá | Metro de Bogotá | 35 | $98,571,429 |
| India | Delhi | Delhi Metro Phase 1 + 2 | 167 | $43,699,867 |
| India | Mumbai | Mumbai Metro Line 1 | 11 | $71,149,762 |
| India | Hyderabad | Hyderabad Metro Phase I | 72 | $54,166,667 |
| India | Bangalore | Bangalore Namma Metro Phase 1 | 42 | $104,659,325 |
| India | Kochi | Kochi Metro Phase 1 | 25 | $36,491,914 |
| Indonesia | Jakarta | MRT | 14 | $109,929,275 |
| Mexico | Mexico City | Metro Línea 12 Extension | 4 | $158,769,459 |
| Mexico | Mexico City | Línea 12 Metro Ciudad de México | 25 | $86,715,346 |
| Mexico | Zona Metropolitana/Valle de Mexico | Suburban Rail Line 1 | 27 | $78,131,686 |
| Mexico | Monterrey | Línea 3 Tren subterráneo de Monterrey | 7.5 | $58,473,896 |
| South Africa | Johannesburg | Gautrain | 80 | $51,257,110 |
| Average | $87,429,209 | |||
| HRT Higher Income Economies | ||||
| United Kingdom | London | Jubilee Extension | 16 | $501,264,813 |
| USA | DC Metro Area | Silver Line Phase 1 | 19 | $165,393,158 |
| USA | Washington DC | 0 | 19 | $152,930,789 |
| USA | New York City | 0 | 17 | $982,658,960 |
| Average | $433,660,969 |
These ranges, divided between developed and emerging economy contexts, should provide a reasonable set of benchmarks when performing back of the envelope alternative cost appraisals.
2.2.2Operating Costs
To date there have been no systematic comparisons of operating costs and the fare-box cost recovery ratios between BRT, LRT, and HRT due to the numerous methodological problems involved. In many higher income countries, BRT systems are operated by agencies that do not keep separate accounts for their BRT operations and their normal bus operations, and there are few operational LRT systems in lower income countries. It was not possible as part of this guide to compile tables of comparative statistics on operating costs and cost recovery ratios. Nevertheless, the following operating costs can significantly diverge among BRT, LRT, and HRT:
- Vehicle cost depreciation and maintenance;
- Catenary depreciation and maintenance;
- Labor;
- Fuel;
- Cost of capital (interest on loans).
Vehicle Cost Depreciation and Spare Parts
A system operator needs to replace rolling stock over time. The cost of the rolling stock should be depreciated over its expected commercial life. For BRT systems, most buses are depreciated over ten years depending on the type of bus and its expected useful life. In Indian and Chinese BRT systems, where the expected commercial life of the bus is lower, the depreciation should be adjusted to reflect this. Typically, the commercial life of rail vehicles is longer, frequently twenty years, so the initial investment should be depreciated over twenty years. These depreciation costs should be calculated using one of the accepted methods for calculating depreciation and reflected as operating costs.
Despite the fact that rail vehicles tend to be depreciated over a longer time frame, their much higher initial cost tends to make the depreciation costs associated with rail systems higher than the depreciation costs associated with BRT systems. One of the reasons that bus costs are far lower than the cost of railcars is the number of manufacturers. With China, India, and Brazil joining Europe and the Middle East as suppliers of buses, the cost of buses is coming down in real terms. An even larger number of countries are able to assemble buses domestically so that only the engines and chassis need to be imported. BRT infrastructure can generally accommodate buses from a wide variety of manufacturers.
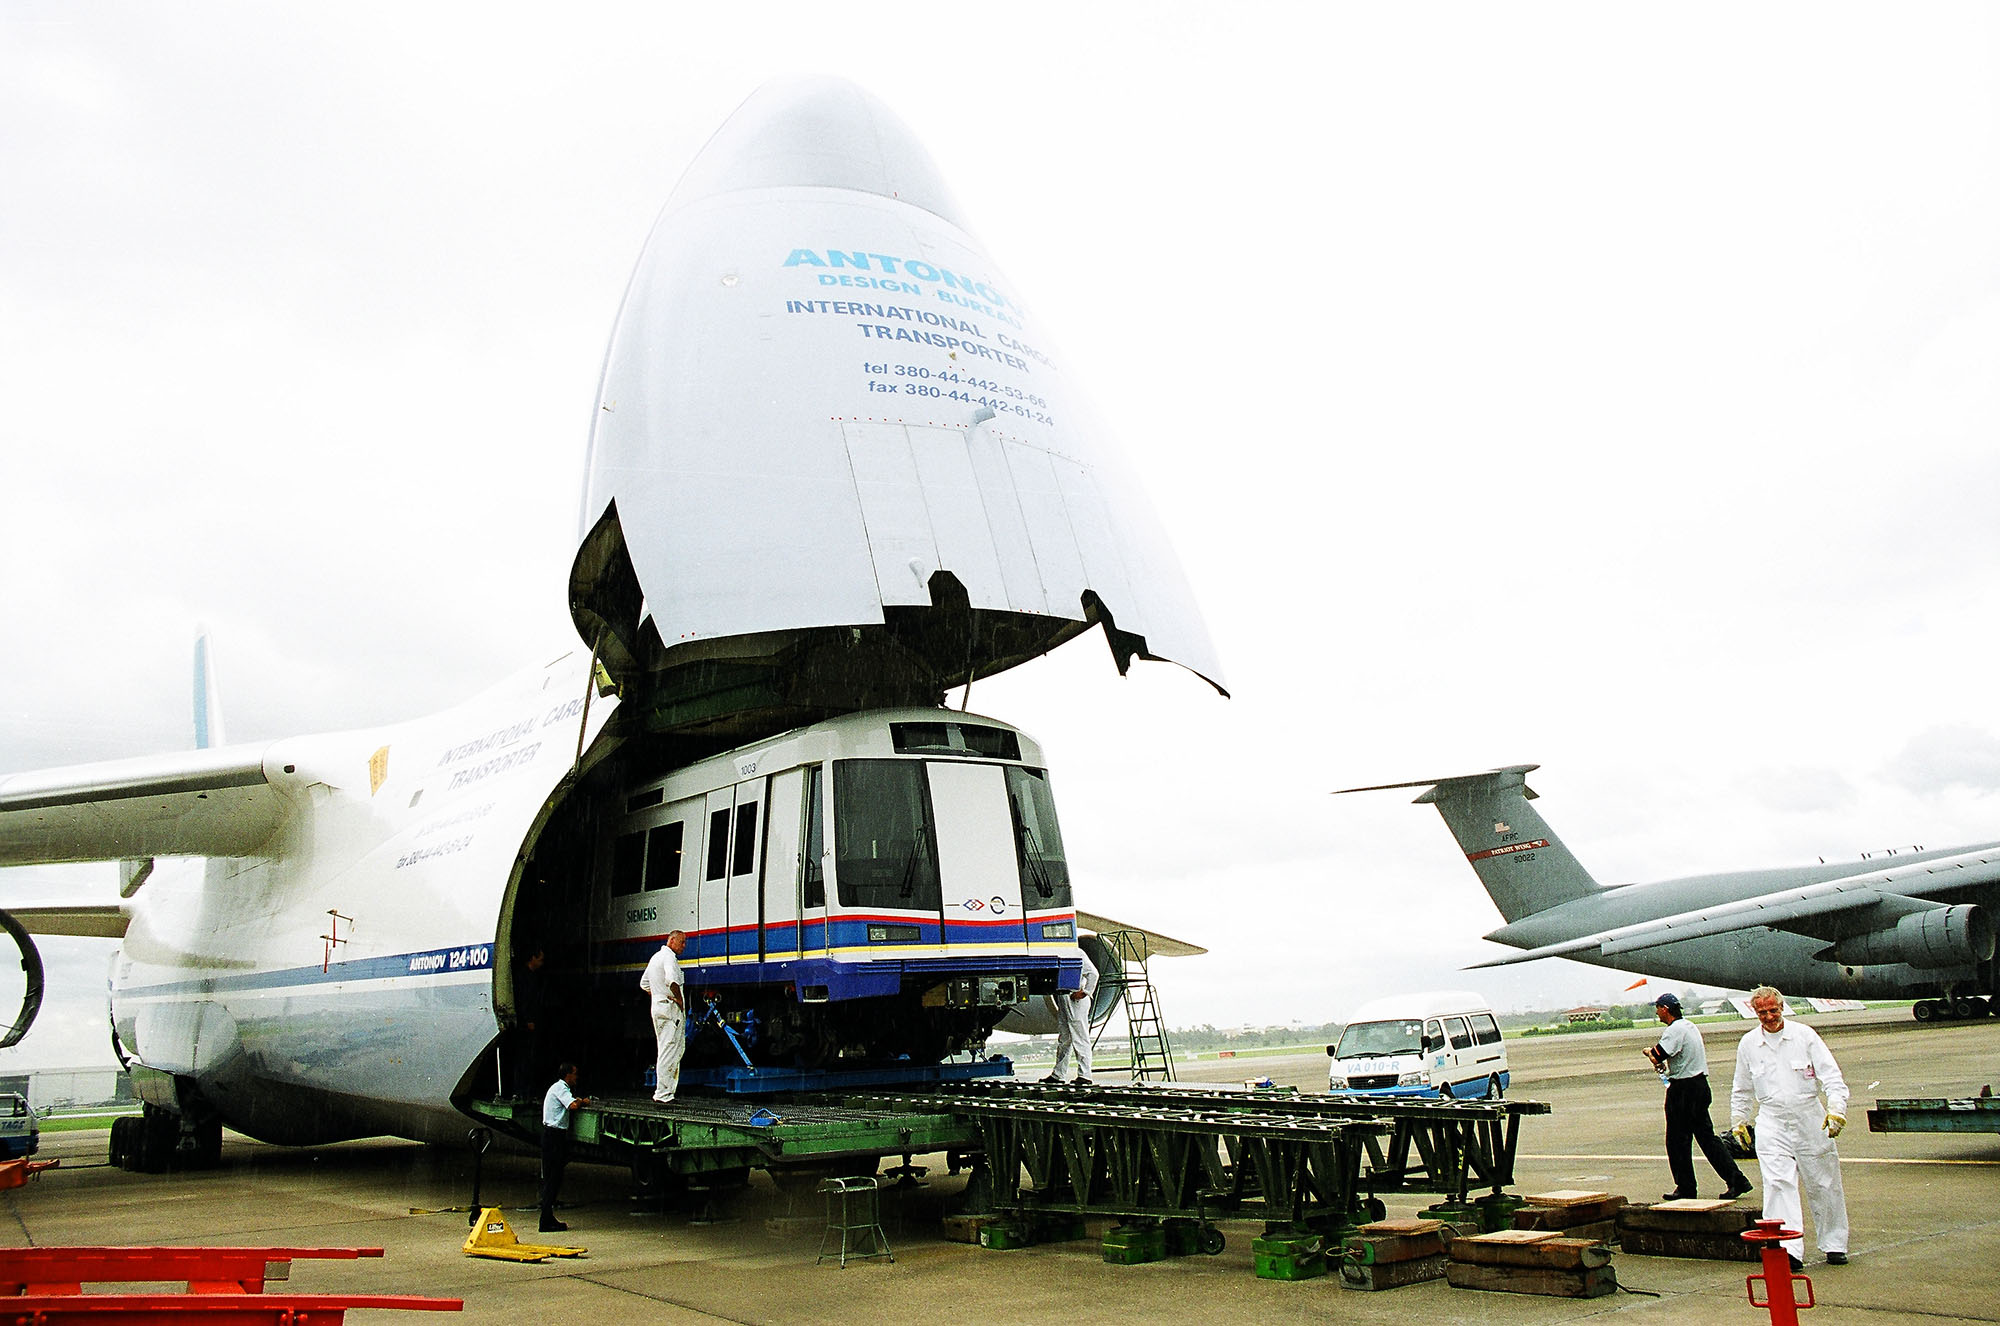
A rail system, by contrast, tends to be locked into a permanent dependence on one or two suppliers of rolling stock. While buses tend to use truck engines where the spare parts have over time come to be produced by alternative low cost producers on a massive scale, the manufacturers of rail technology tend to remain monopoly suppliers of their spare parts, as the market for them is far more limited. These monopolistic conditions tend to drive up the operating cost of rail rolling stock. There are only a few major rail manufacturers in the world today (i.e., Alstom, Bombardier, Hitachi, Kawasaki, and Siemens). The scale required to set up local rail manufacturing is unlikely to be achieved in most lower income nations. Instead, manufacturing (and the associated employment) will be based in higher income countries, such as France, Canada, Japan, or Germany. When a city such as Bangkok purchases its rail metro vehicles, the carriages arrive almost fully fabricated (Figure 2.1). This tends to make the vehicles far more expensive.
The long-term cost of keeping the rolling stock operational is even more sensitive to the cost of spare parts. Over the life of a bus or a railcar, far more money is spent overall on spare parts than on the initial cost of the vehicle’s procurement. The same monopolistic conditions that tend to drive up the procurement cost of rail vehicles relative to buses also affect the supply of spare parts. While some bus operators are also partially locked into expensive spare parts contracts with the bus suppliers, a growing number of bus operators are successfully switching to generic spare parts suppliers that considerably reduce their overall costs. With rail vehicles, it is far more difficult to avoid a dependence on the original manufacturer for spare parts, driving up costs.
Catenary Depreciation and Maintenance
One of the primary operational cost differences between BRT systems and LRT and HRT systems is the cost of depreciating and maintaining the electric catenary. These costs have escalated in recent years (Cervero, http://www.uctc.net/papers/UCTC-FR-2010-32.pdf , p. 9). The overhead wires of an LRT system or an electric trolleybus BRT system need to be maintained well, since a failure results in system shutdown. A system shutdown imposes massive operating costs on the operator. These overhead wires are generally quite expensive to maintain and need to be replaced periodically. These costs are absent from BRT systems using diesel technology.
It should be noted that recent advances in electric battery technology have made battery-powered electric vehicles a more affordable option for transit vehicles, as seen by new fleets of battery-powered electric buses and trams in operation or on order in Thailand, China, and the United States (as of 2016). Given the new technology, it is not clear how these vehicles will compare in terms of operating and maintenance costs, as compared to gasoline-powered buses or electric trolley buses or trams, but they should be monitored as a potential option.
Labor
The labor involved in BRT, LRT, and HRT systems is similar: vehicle operators, head office (administrative) personnel, vehicle maintenance personnel, control center personnel, fare collection services personnel, other station services personnel. A system with a similar number of stations, a similar number of vehicles, and a similar type of fare collection system should have similar labor costs. The cost of labor for rail vehicle maintenance personnel and rail vehicle operators is likely to be higher than the cost for bus operators and bus maintenance personnel as these professions are more highly specialized and require a greater degree of technical training. Typically, these staff are provided by the vehicle manufacturer for several years as part of the initial procurement arrangement. LRT vehicle operators also tend to be somewhat better paid as it is a more specialized profession.
LRT and HRT systems may gain savings in labor cost from reductions in fleet size and hence the number of vehicle operators needed. LRT and HRT vehicles come in sizes larger than the largest BRT vehicles (biarticulated buses) and can therefore carry more passengers with a single operator, reducing labor costs.
However, as explained in Chapter 6: Service Planning, this guide recommends optimizing the vehicle size following a formula that finds the optimal trade-off between minimizing passenger waiting times (with high frequency) and minimizing labor costs (with larger vehicles). While the formulas for calculating optimal vehicle size included in Chapter 6 were developed for BRT systems, they can equally be applied to LRT systems.
For any given demand profile on a transit corridor, the number of vehicles needed to satisfy peak hour demand should be set based on a vehicle size that provides the optimal trade-off between passenger waiting costs and vehicle operator labor costs.
Because in higher income countries, the value of waiting time is worth more than in lower income countries, but vehicle operators also get paid more, this trade-off works out to be roughly the same vehicle size in both higher and lower income countries.
Labor can represent between 35 to 75 percent of operating costs in Europe and North America, while the labor component of lower income country systems is generally closer to 20 percent, so in higher income countries, people value their waiting time more but vehicle operators also cost more.
Unsurprisingly, this cost-benefit analysis shows that smaller vehicles are more optimal for lower demand systems and larger vehicles are more optimal for higher demand systems. In high demand systems, there are diminishing returns to higher frequencies, so larger vehicles tend to be more attractive. In low demand systems, very low frequencies will make waiting times a very significant cost for passengers and can have a significant adverse impact on ridership.
In most typical operating conditions, the optimal vehicle size for an LRT or a BRT is lower than the largest BRT vehicle. As such, any operating benefits of using larger LRT vehicles are offset by even higher costs faced by waiting passengers, so the operational cost savings are being purchased at the expense of passengers.
Fuel Costs
Fuel price volatility can represent a significant financial risk to a transit system operator. A sudden increase in fuel prices can drive a reasonably profitable transport system suddenly into debt. Quito’s electric trolleybus BRT, for instance, was initially profitable until Ecuador privatized its electricity and electric prices rose sharply, creating large operating losses for the City of Quito’s electric trolleybus BRT operation. Fuel price volatility can affect any fuel, whether it is electricity, diesel, CNG, LPG, or some other form.
Electric-powered modes, such as LRT, HRT, and electric-trolleybus-powered BRT, can be cheaper to power in countries with a plentiful, stable, and low cost electricity supply (such as those with ample hydroelectric power) than in countries with high cost, unstable electricity supplies. Electricity prices per kilowatt hour vary from as low as US$0.02 or US$0.03 in some countries to greater than US$0.40 in island nations, with prices across Europe varying from about US$0.12 in Central and Eastern Europe to between US$0.20 to US$0.30 in most of Western Europe.
One advantage of BRT systems is that there are generally more fuel alternatives available. Whereas electricity prices are low and stable, it may be that the higher costs of procuring electric trolleybuses and maintaining their catenary can be justified by fuel cost savings, as was the case with the first BRT corridor in Quito. When electricity prices rose in Ecuador, Quito was able to select a diesel alternative for the next BRT corridor. Where CNG is inexpensive and the prices are stable, CNG buses can offset the higher vehicle and spare parts costs with lower fuel costs. CNG prices have fallen in many countries recently due to new methods of extraction. Diesel prices tend to be more stable internationally, though the tax treatment of diesel fuel varies widely. GIZ publishes annual average fuel prices across the world as a quick reference for relative fuel prices (http://www.giz.de/expertise/downloads/giz2014-en-international-fuel-prices-2013.pdf).
BRT systems can also introduce new buses that use hybrid-electric technology, CNG, LPG, ethanol blends, hydrogen fuel cells, or other alternative fuels. This has also proved to be important for resilience in the case of major power outages.
The market for HRT and LRT vehicles is dominated by those powered by electricity, limiting options where other fuels make more economic sense. That said, diesel multiple units do provide a diesel option for rail vehicles, but they serve a small portion of the rail vehicle market. Hybrid diesel-electric rail vehicles also provide more resilient options combining fuel technologies. In addition, there are efforts to bring CNG-powered rail transit vehicles to market, but these are not yet widely available.
Cost of Capital
If a transit operator has to borrow money to pay for either the infrastructure or the rolling stock, or both, the cost of paying this debt becomes an operating cost. If a national or state government is willing to pay for an urban transit capital investment, there will be no new debt service, and the cost of capital will be zero. On the other hand, if a transit operator has to borrow money to pay for a capital improvement, debt service will have a big impact on operating costs.
In the most indebted transit systems, debt financing costs can account for upward of 30 percent of operating deficits (http://council.nyc.gov/downloads/pdf/budget/2014/mta.pdf).).
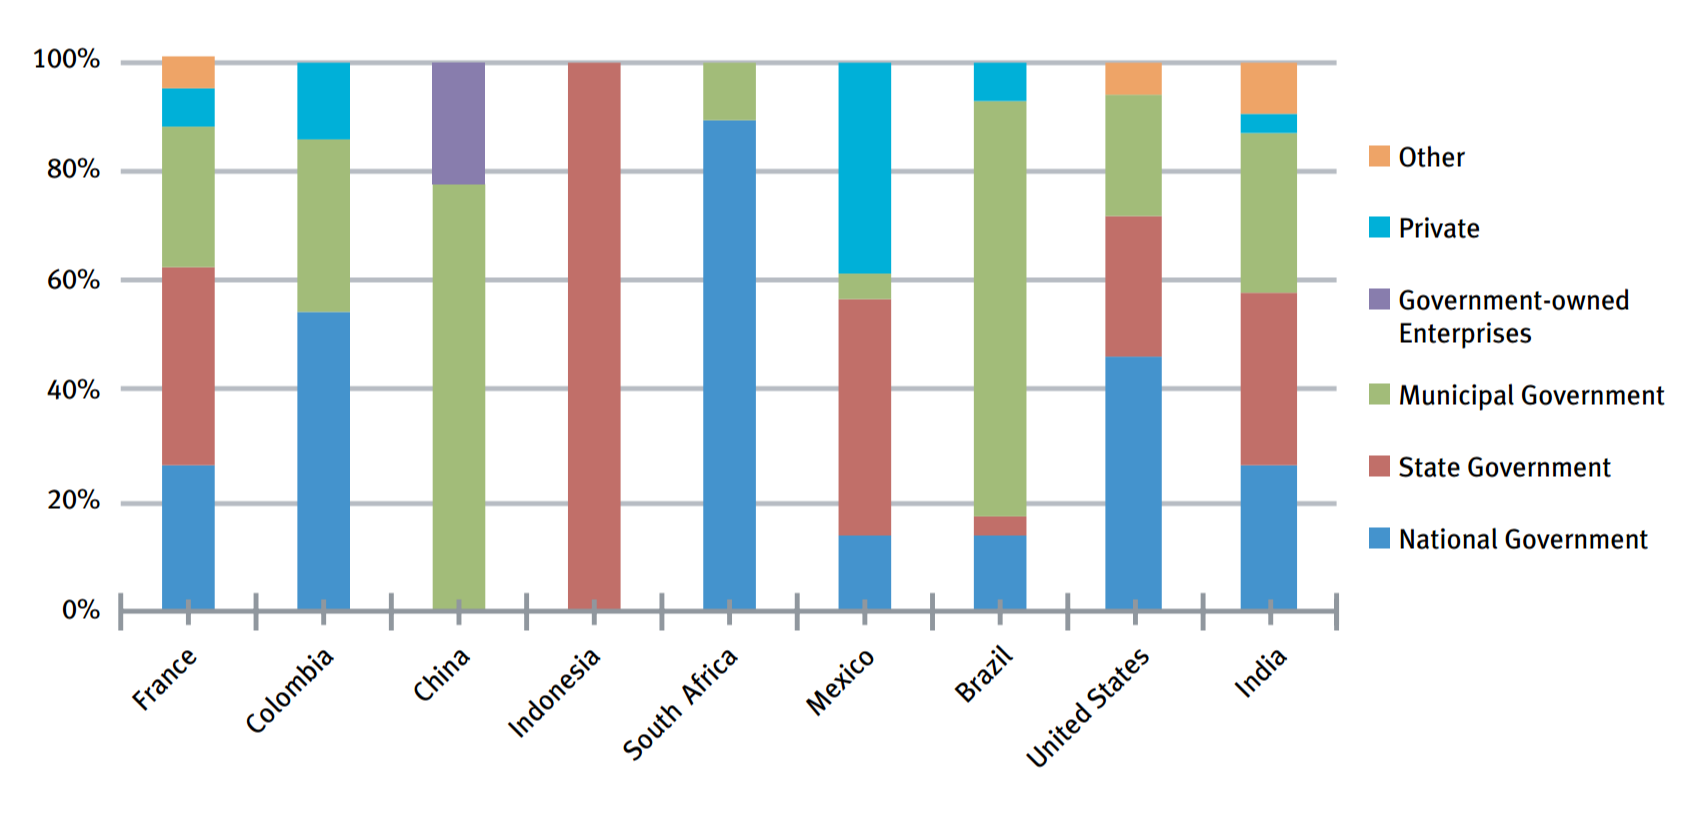
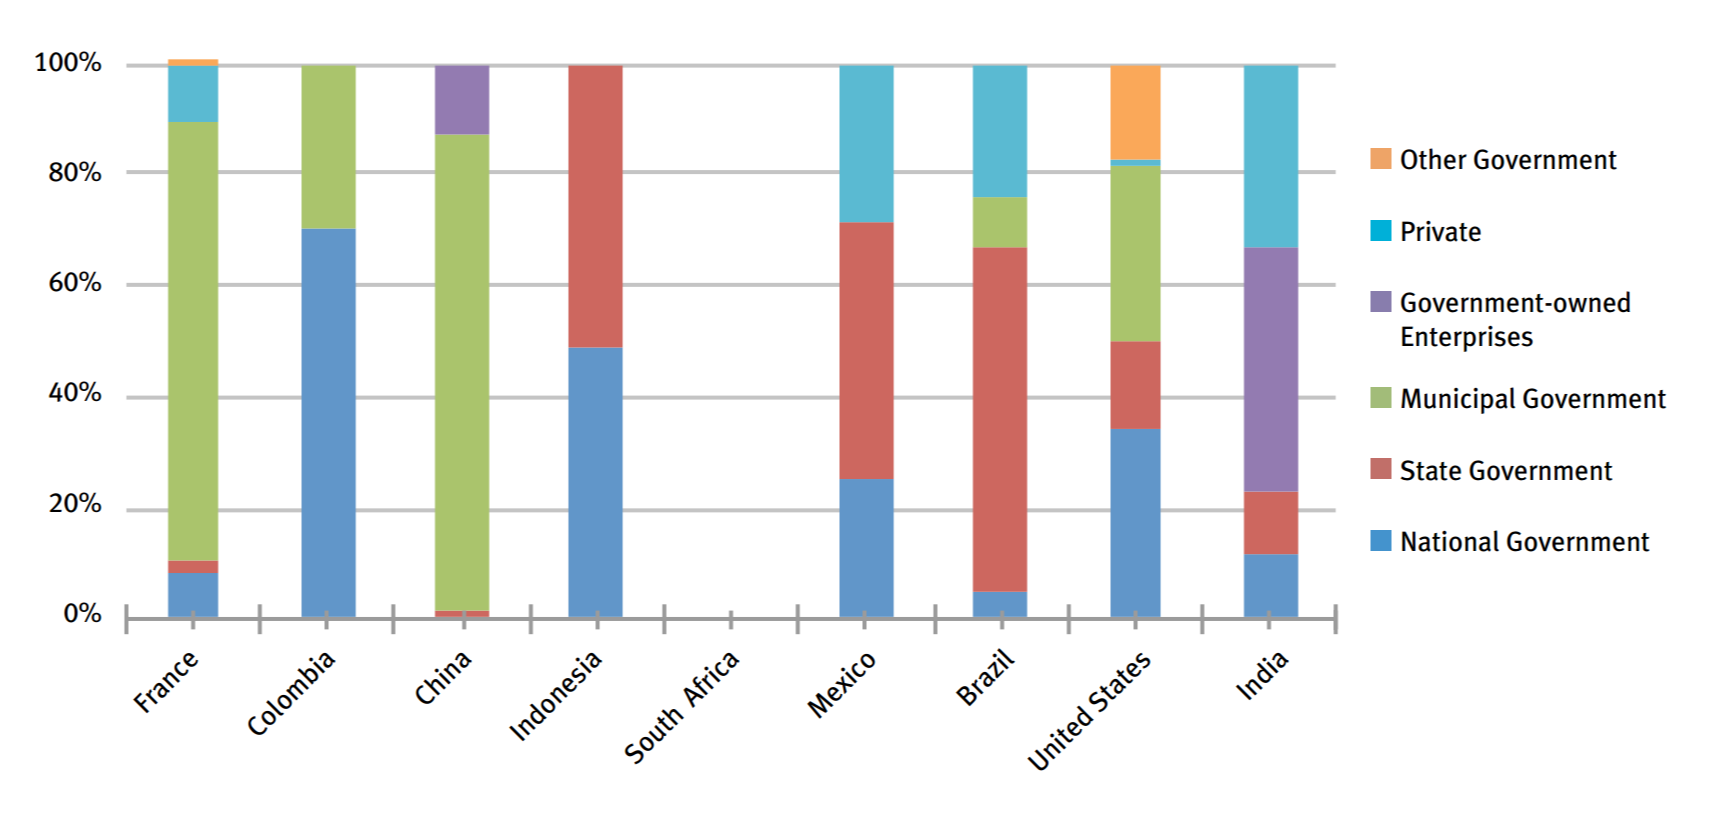
A national or state government bias in terms of which mode they are willing to support with capital investments can therefore have a profound impact on operating costs. A recent study (https://www.itdp.org/publication/best-practice-in-national-support-for-urban-transportation-part-2/, ITDP, 2015) indicates that while many national and state governments are neutral in terms of their willingness to fund LRTs, BRTs, or HRTs, in a few countries (India, Indonesia, and Brazil), state and national governments have played a much larger role in underwriting the cost of rail projects than BRT projects. The United States in recent years has had a policy of promoting streetcars, a variety of LRT, which made them more likely to receive federal government capital grants.
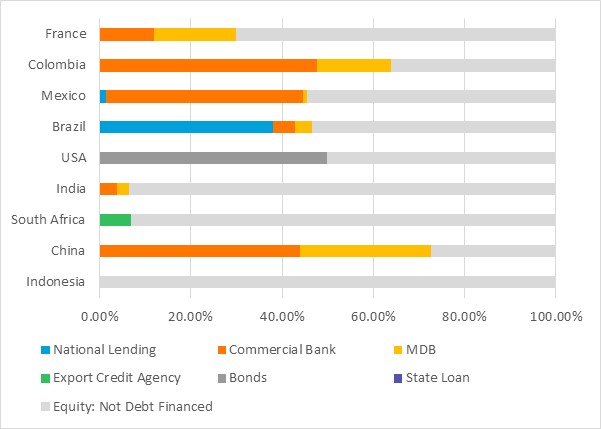
Rapid transit systems are classic examples of public investments that make sense for public debt financing. Because the benefits of a well-designed transit system will be enjoyed for decades to come, it is reasonable to pass some of the construction costs on to future taxpayers. According to the aforementioned study, countries that debt finance their transit infrastructure tend to produce more kilometers of transit per capita than countries that rely purely on current account funds. The manner in which these costs are financed, however, can have a profound impact on system operating costs. This study that looked at urban transit financing in nine countries \ indicated the following five typical sources of transit financing:
- Bonds;
- Bilateral loans or loans from Export Credit Agencies;
- Multilateral Development Bank (MDB) loans;
- Commercial loans;
- National Government and National Development Bank loans.
These different sources of financing sometimes are not equally available to all transit modes.
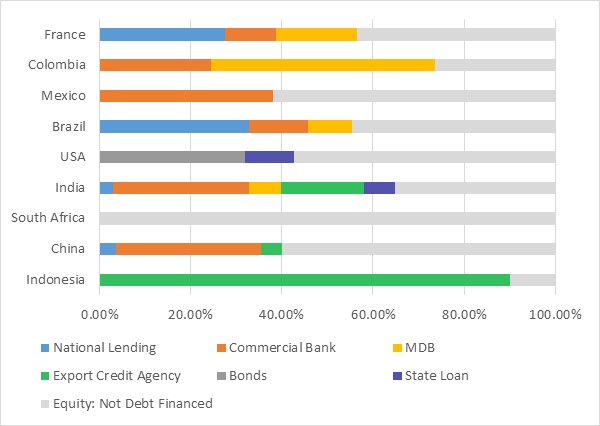
Projects financed by commercial loans, the multilateral development banks, or the sale of municipal bonds tend to be mode neutral. Of these, commercial loans are the most expensive, municipal bonds are lower in cost, and loans from the multilateral development banks tend to be the lowest cost of capital. BRT, LRT, and HRT projects have all been financed by commercial loans, MDBs, and municipal bonds, with no clear pattern of mode-specific bias observable.
The export credit agencies, by contrast, tend to provide credit only for modes tied to commercial interests from their country, but they offer very low interest rates that can fundamentally change comparative project costs. The Jakarta Metro, for instance, is being financed by a loan from JICA (Japanese International Cooperation Agency) at 0.2 percent interest, which is a negative capital cost (below the cost of capital). This helps support the Japanese rail manufacturing industry. The export credit agencies of the Nordic countries where Volvo and Scania, major bus manufacturers, are housed have also played a role in lowering the cost of bus procurement in BRT projects in Latin America and South Africa. In addition, the Spanish export credit agency financed the purchase of Spanish electric trolleybuses for the first BRT line in Quito. While export credit agencies subsidize both bus and rail projects, there is greater foreign government interest in selling rail technology, and larger sums involved, which frequently results in lower cost financing from export credit agencies available for rail projects than is generally available for BRT projects.
National development banks can also play key roles in determining the cost of different projects. In Brazil, credit from BNDES is considerably lower in cost than commercial credit, giving BNDES enormous influence over modal selection in Brazilian municipalities. BNDES has funded both rail and BRT projects, but a lot more funding has been directed to rail projects overall.
Ideally, state and national government grant programs for urban rapid transit should be based on mode-neutral selection criteria, as should the funding and financing criteria of the development banks and export credit agencies.