2.5Impacts
The only limit to your impact is your imagination and commitment.Tony Robbins, motivational speaker, 1960–
The characteristics of different public transport technologies can result in different impacts as measured by economic, environmental, social, and urban indicators. Since public transport is often used as a policy measure to achieve a variety of social goals, an analysis of each system’s impact is a legitimate part of the technology evaluation.
2.5.1Economic impacts
Economic impacts can include the public transport system’s ability to stimulate investment in the corridor and stimulate job creation.
Land Development
A prized objective with public transport systems is to encourage transit-oriented development (TOD), which refers to the dense walkable, bikeable urban development along corridors. If a public transport project is implemented successfully, the creation of dense urban corridors can help increase property values as well as shop sales levels.
Table 2.11Transit Corridors Typology: TOD Investment in North America and Determining Factors
| Corridor | Mode | The BRT Standard Score | Land Potential | Government TOD Support | Total TOD Investments (in millions) | Investment per Dollar of Transit Investment | |
|---|---|---|---|---|---|---|---|
| Weak TOD Investmenti | |||||||
| Ottawa O-TrainWeak | HRT | bronze | Limited | Weak | nominal | nominal | |
| Pittsburgh ""The T"" Weak | HRT | bronze | Limited | Weak | nominal | nominal | |
| Las Vegas Metropolitan Area Express (MAX) Moderate | busway | bellow basic | Limited | Weak | nominal | nominal | |
| Pittsburgh West BuswayWeak | BRT | basic | Limited | Weak | nominal | nominal | |
| Pittsburgh South BuswayWeak | BRT | basic | Limited | Weak | nominal | nominal | |
| Moderate TOD Investment | |||||||
| Denver Southwest CorridorModerate | LRT | bronze | Limited | Moderate | $ 160 | 0.71 | |
| Eugene Emerald Express Green Line (EmX) Moderate | BRT | bronze | Emerging | Moderate | $ 100 | 3.96 | |
| Los Angeles Orange LineModerate | BRT | bronze | Emerging | Moderate | $ 300 | 0.83 | |
| Boston Washington Street Silver LineModerate | busway | bellow basic | Emerging | Moderate | $ 650 | 20.97 | |
| Charlotte LynxModerate | LRT | bronze | Emerging | Moderate | $ 810 | 1.66 | |
| Pittsburgh Martin Luther King, Jr. East BuswayModerate | BRT | bronze | Emerging | Moderate | $ 903 | 3.59 | |
| Ottawa TransitwayModerate | BRT | bronze | Emerging | Moderate | $ 1,000 | 1.71 | |
| Boston Waterfront Silver Line | busway | bellow basic | Strong | Moderate | $ 1,000 | 1.39 | |
| Las Vegas Strip & Downtown Express (SDX) | BRT | bronze | Strong | Moderate | $ 2,000 | 42.28 | |
| Denver Central CorridorModerate | LRT | bronze | Strong | Moderate | $ 2,550 | 14.88 | |
| Phoenix MetroModerate | LRT | bronze | Emerging | Moderate | $ 2,821 | 1.99 | |
| Strong TOD Investment | |||||||
| Seattle South Lake Union (SLU) Streetcar Strong | LRT | bellow basic | Strong | Strong | $ 3,000 | 53.57 | |
| Portland StreetcarStrong | LRT | bellow basic | Strong | Strong | $ 4,500 | 41.48 | |
| Kansas City Main Street Metro Area Express (MAX) | busway | bellow basic | Strong | Strong | $ 5,200 | 101.96 | |
| Cleveland HealthLine | BRT | silver | Emerging | Strong | $ 5,800 | 114.54 | |
| Portland MAX Blue Line | LRT | silver | Emerging | Strong | $ 6,600 | 3.68 |
Source: Hook, Walter, Annie Weinstock, and Stephanie Lotshaw, More Development for Your Transit Dollar, ITDP, 2013
There is little debate that in the right conditions HRT investments can leverage significant investment in transit-oriented development (TOD).
More Development for Your Transit Dollar, a study of the likelihood of both LRT and BRT investments in the United States and their impact on stimulating economic development concluded that both LRT and BRT had a similar chance of stimulating or not stimulating economic development, so long as they are of similar quality, as measured by the BRT Standard. (Hook, Walter, Annie Weinstock, and Stephanie Lotshaw, More Development for Your Transit Dollar, ITDP, 2013) (https://www.itdp.org/more-development-for-your-transit-dollar-an-analysis-of-21-north-american-transit-corridors/)
The study proved that the level of TOD investment that results from a transit investment is primarily related to two characteristics unrelated to the transit mode: the level of government intervention to promote development at the site, and the inherent value of the land as a development opportunity. A site where the government has rezoned the area for development, invested in new infrastructure, provided tax breaks and other incentives to attract developers, and otherwise intervened to promote development around a transit station was far more likely to attract investment, regardless of whether the system is BRT or LRT. The inherent development potential of the land also mattered. A new transit line serving a downtown in a process of revitalization, or a popular new waterfront destination, is likely to stimulate more development than a blighted low-income area regardless of the type of transit investment made. However, the study also concluded that because the BRT investment was cheaper, the amount of new investment per dollar of public transit investment was far greater for the BRT investments. For this to hold true, however, the transit investment needed to be of equivalent quality.
In lower income countries, the development impacts of LRT are not well known, as there are few LRT systems in lower income countries. The evidence of economic development impacts of BRT in lower income countries has yet to be systematically studied, but there are a few studies available.
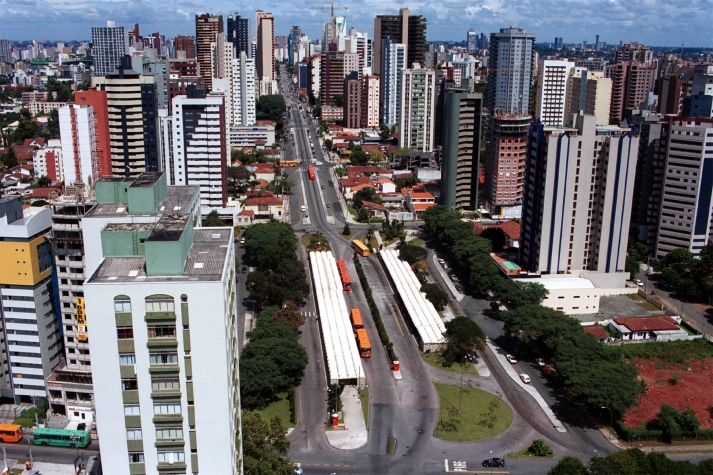
It is clear that massive development occurred along most BRT corridors in Curitiba. Zoning was the primary tool used to concentrate development along the BRT system. The zoning rules were changed before the city went through a significant growth in population, so much new development was channeled along the BRT corridors.
A recent study by the World Bank of the development impacts of BRT systems in Guangzhou, Bogotá, and Ahmedabad (Transforming Cities with Transit: Transit and Land Use Integration Towards Sustainable Urban Development, 2012) indicated that densification at levels higher than observable in other parts of the city did occur in Bogotá, but only in Phase II corridors, where there was more land available for development. Unlike in Curitiba, there was no particular zoning incentive in place in Bogotá to channel new development to the BRT corridors. In Ahmedabad, the system was still too new to determine the degree of land development impacts. Ahmedabad recently enacted zoning changes that allow for higher density development along its BRT system, but the zoning changes are too recent to determine their impact. Land assembly is harder in India than in China, and large plots of institutional land along the BRT corridor inhibit development along some parts of the BRT system, while preexisting built-up structures inhibit new development in other areas. In Guangzhou, extremely high-density development occurred on the parts of the Guangzhou BRT corridor where the system crosses the metro system, and in the lower density parts of the corridor farthest from the CBD.
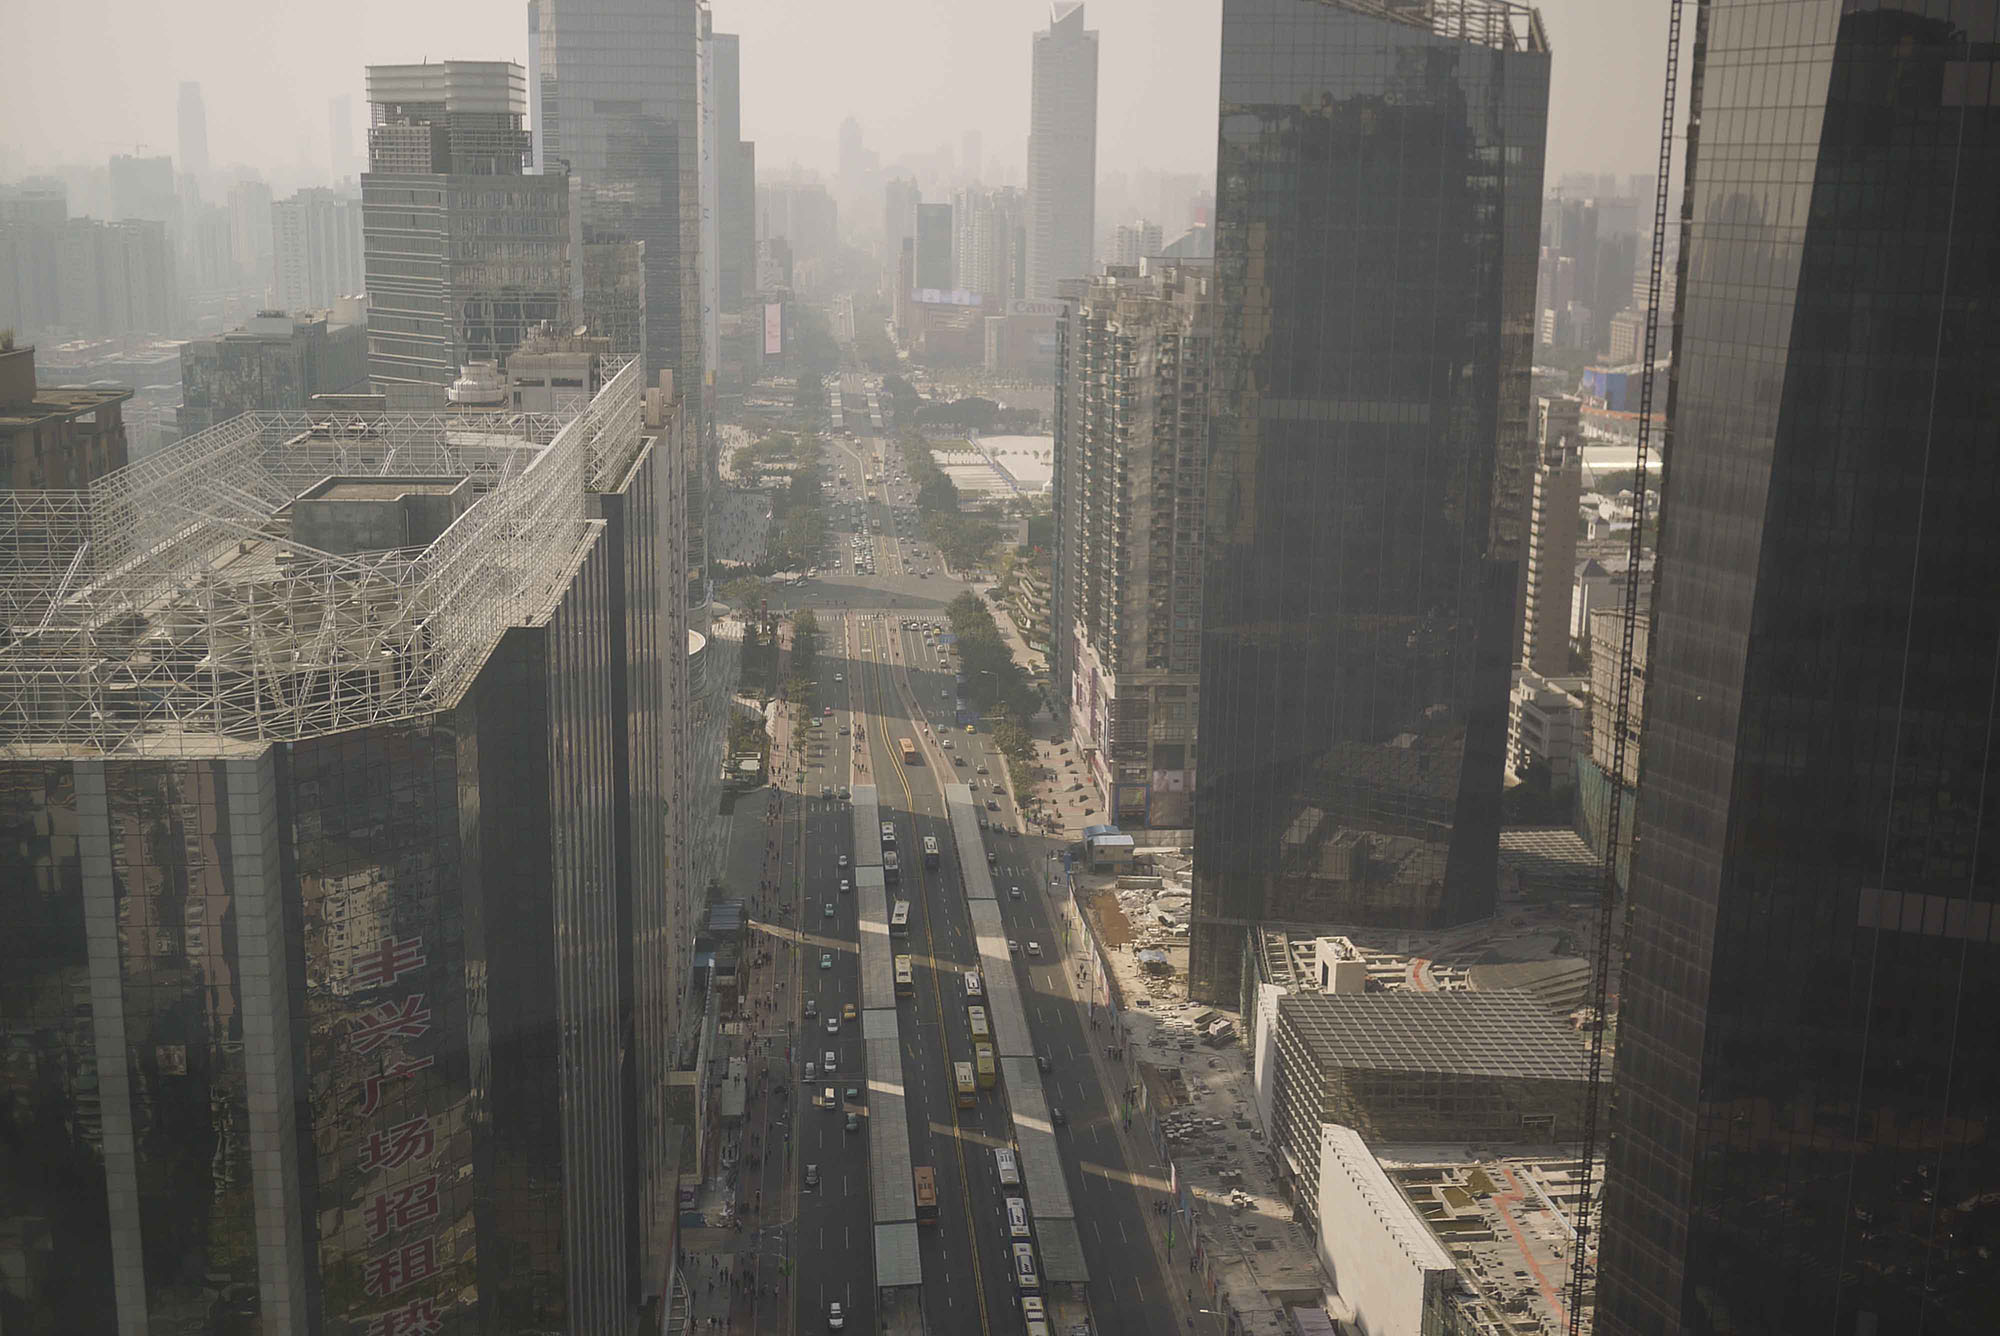
In Guangzhou, there was no specific zoning incentive to build along the BRT system or the metro system, so the high-density development that occurred was largely the result of market forces.
In all cases, then, supportive zoning and the availability of developable land appear to be critical factors. These factors would affect all transit modes equally. In conclusion, there is a growing body of evidence to suggest that BRT and LRT will result in a similar level of new economic development if all other variables are equal, and these other variables are much stronger determinants of economic impacts than the selection of transit mode. Because BRT is generally cheaper to build, however, the economic development impacts of BRT are superior to those of LRT and probably those of HRT per dollar of transit investment.
Employment
Employment generation is another economic measure of a project’s impact. Public transport projects generate employment through the planning and construction phase, equipment provision (e.g., vehicles), and operation. While there have been few systematic studies of the relative merits of different transit investments for job creation, a useful metric would be jobs created per dollar of public investment.
The employment generated during the construction phase is mostly determined by how extensive the required construction is and how labor intensive the construction process is. HRT systems naturally will tend to generate more construction jobs because the construction involved with elevating or tunneling is much more extensive than for surface systems.
BRT and LRT, which make similar changes to the street, will tend to generate similar levels of employment. Per dollar of investment, BRT may generate a few more jobs because the construction techniques required are similar to those for normal roads, and as such more likely to be adaptable to labor-based road construction methodologies. Labor-based road construction is something that has been understudied, but extensive studies in South Africa indicate that the labor content of road construction techniques can be significantly increased with contracting procedures that create the right incentives.
The fabrication of mass-transit vehicles also offers the potential for local employment gains and the transfer of new technology to a nation. Bus assembly is by far the easiest element of the rapid transit vehicle manufacturing process to introduce locally. Major international bus manufactures have established bus body production facilities in BRT cities such as Curitiba, São Paulo, Pereira, Colombia, and Bogotá, as well as normal buses usable for BRT in Guangzhou, Shanghai, and Beijing. Indian bus manufacturers also produce all of the buses operating in Indian BRT systems. South Africa also assembles buses. Fewer countries manufacture bus engines and chassis, but bus engine manufacture is also spreading to lower income countries. A bus engine is essentially a truck engine, so massive economies of scale can be realized in the production of bus engines. All of these help develop local business and create local employment.
Rail-car production is generally not as transferable. The economies of scale with rail-vehicle production imply that it is difficult to transfer fabrication from headquarter plants in countries such as Canada, France, Germany, Spain, and Japan, though Bombardier recently opened a metro car fabrication facility in India. The importation of vehicles carries with it particular costs and risks, such as import duties and long-term currency fluctuations. Additionally, the importation of rail vehicles tends to create an awkward situation where tax funds in low-income nations are supporting employment and technology development in wealthier nations.
All new public transport systems present both an opportunity and a threat in terms of operational employment. The specific opportunity and threat depends entirely on the services being planned. If the vehicles specified for use in the new transit system follow the recommendations made in Chapter 6, then in most cases similar numbers of BRT and LRT vehicles would be needed, as well as similar levels of employment. That LRT and HRT systems frequently use larger vehicles, however, means that these systems tend to be more capital intensive and less labor intensive, having fewer employment benefits.
Normally, a new transit system will replace an existing transit service, usually either formal or informal bus operations. All of these systems may imply a reduction of employment when many smaller vehicles are being replaced by larger articulated vehicles moving at faster speeds. However, most new BRT systems are designed to be roughly employment neutral, in order to protect the livelihoods of working people. In Bogotá the loss of informal bus driver jobs was mitigated by the fact that the BRT drivers are working shorter shifts and making equal or better incomes. Previously, a single driver would work as many as sixteen hours per day. In the current system, more drivers share the same vehicle. Likewise, new employment was created through new positions related to fare collection, administration, management, and security.
2.5.2Environmental Impacts
In any transit system, more passengers means greater environmental benefit. To know the actual environmental impact of a public transport project, one has to look at a number of factors: the impact the project has on modal shift (how many former motorists are using the new transit system), the vehicle miles travelled by the transit fleet before and after project implementation, the emissions related to construction, and the vehicle-specific emissions from the transit vehicles. This guide recommends the use of the Transportation Emissions Evaluation Model for Projects (TEEMP), or the modified version developed for the Global Environmental Facility, for estimating these impacts (https://www.itdp.org/transport-emissions-evaluation-model-for-projects-teemp-brt or http://www.thegef.org/gef/GEF_C39_Inf.16_Manual_Greenhouse_Gas_Benefits).
One of the major environmental downsides of HRT projects is that they involve extensive heavy construction and the use of concrete and steel. Construction and the production of concrete and steel produce CO2. Some estimates indicate that the greenhouse gas emissions generated by construction and the production of the concrete and steel used to build an HRT system will take about twenty years to be recouped from reduced traffic emissions (see TEEMP study). LRT will also consume more steel than a BRT but otherwise the construction involved should be similar.
LRT and HRT have local environmental and public health benefits over standard diesel-powered BRT systems, as they run on electricity and generate no localized air pollution. While NOx and CO are concerns for BRT systems using diesel, by far the biggest health concern systems using diesel fuels and engines that are Euro III or worse is particulate emissions that tend to concentrate in stations. Unhealthy levels of particulates were measured in TransMilenio stations when Euro II vehicles were in use.)
These emissions should be mitigated in BRT systems using Euro IV vehicles with a particle trap or cleaner vehicles (Euro V, Euro IV, etc.), so long as the necessary low sulfur diesel fuels are available. Alternatives such as electric trolleybuses are used in some cities (Quito, São Paulo), and CNG in others (Jakarta, Seoul, Lima), which have solved the particulate problem, though these alternatives often introduce other problems. Maintenance of the electric catenary is expensive in electric trolleybus systems. When the municipal power company is in control of the catenary and not particularly responsive to the trolley operator, as has been the case in São Paulo, maintenance problems can cause severe operational difficulties. CNG resolves the particulate problem but generates as much NOx, NO2, and CO as diesel. It also requires more expensive engines and a sufficient number of refueling stations. Jakarta’s use of CNG helped reduce particulates at the stations but added a lot of dead kilometers and CO2 emissions because there were too few refueling stations near the BRT corridors.
Electric power’s environmental impacts depend on how that power is generated and where it is generated. If the source is coal-fired power plants, then the system may actually produce more CO2 than normal diesel vehicles do. Complications in calculating the environmental impacts of electricity has been one of several reasons why to date only BRT projects have been approved by the Clean Development Mechanism for funding.
Both BRT and LRT have the potential to reduce bus sector emissions by replacing a large number of old polluting buses with a smaller number of cleaner BRT buses or LRT vehicles operating at higher speeds. These impacts are highly dependent on the service plan. A well-designed service plan for an LRT system with proper bus-based feeder services should be similar in its environmental impacts to a trunk and feeder BRT system with a similar service plan.
2.5.3Social Impacts
Social impacts can refer to the ability of a new public transport system to help create more social equity within a city, or to the ability to reduce accidents and improve traffic safety. Social impacts can also refer to changes in the safety and sociability of the streets.
The social impacts of a new rapid transit system are likely to be similar for BRT, LRT, and HRT, with the exception of the following considerations: in lower income countries, the lower operating costs of BRT have meant that these systems tend to be operated at a profit or with very modest operating subsidies, placing less of a strain on municipal budgets. In Mexico City, for instance, the BRT network operates at nearly full cost recovery, while subsidization of the subway system constitutes a major drain on municipal finances, taking resources away from other social needs. In higher income countries, BRT systems tend to be operated by subsidized transit authorities, and operational savings in the bus system tend to be put back into service improvements. As the users of bus systems in the United States tend to be lower and middle income, the systems directly benefit the working poor. Rail property investments, by contrast, have often led to bus service cuts in lower income areas, leading at times to lawsuits, such as the famous lawsuit of the Bus Riders Union in Los Angeles against fare increases and service cuts implemented at the same time as the Red Line subway was implemented.
Further, in lower income countries, BRT has been used to encourage locally owned business enterprises. Most BRT operators in such countries came from former informal bus operator consortiums or enterprises whose businesses would otherwise have been adversely affected by the new rapid transit system. This incorporation of the affected bus and minibus owners and operators into the ownership structure of the BRT operating companies (see Chapter 9: Strategic Planning for Communications) was a major selling point for the South African National DOT when promoting BRT in South Africa, as it was trying to promote black- and people-of-color-owned businesses and minimize unemployment. South Africa also hired locally for many elements of station operation and construction, design, bus fabrication, and other elements of the BRT business. Rail systems, by contrast, are unlikely to have nearly as many upstream and downstream local economic benefits, as the suppliers of the equipment, rolling stock, and spare parts tend to be concentrated in a few countries (Japan, France, Germany, and Canada).
For most other social impacts, there is no particular reason why BRT, LRT, or HRT should have better or worse social impacts than the other modes. Both BRT and LRT projects should be seen as opportunities for redesigning surface streets to make them safer and more hospitable to cyclists and pedestrians.