2.4Performance
It is not the strongest of the species that survive, not the most intelligent, but the one most responsive to change.Charles Darwin, scientist, 1809–1882
A system’s performance characteristics will play a large role in determining customer-usage levels. The ability of a system to attract ridership is thus a prime decision-making determinant in selecting a public transport technology.
2.4.1System Capacity
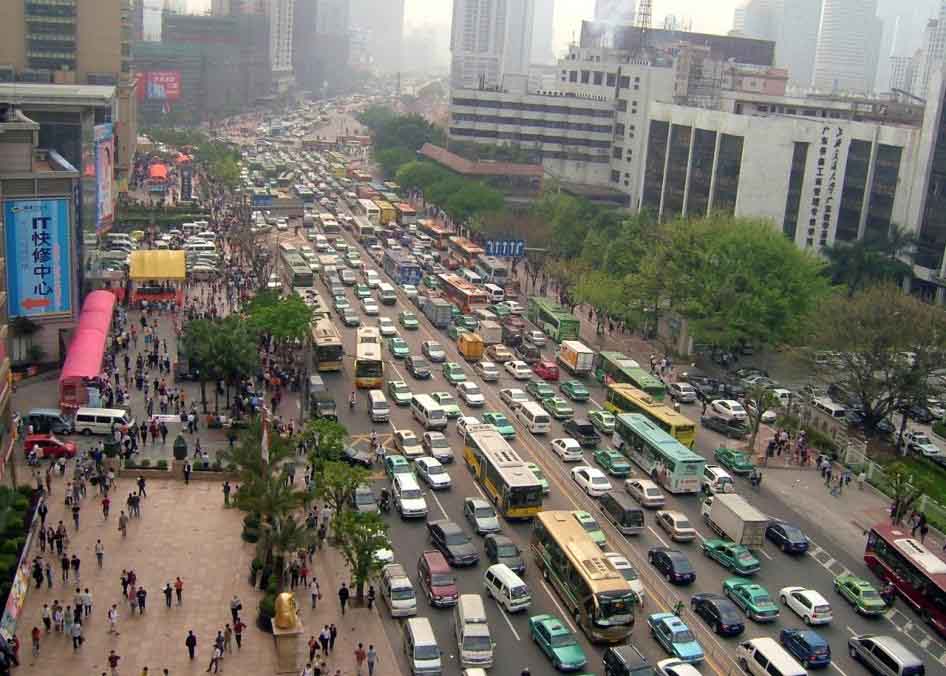
The ability to move large numbers of passengers is a basic requirement for rapid transit systems. This characteristic is particularly important in cities in lower income nations where mode shares for public transit can exceed 70 percent of all trips. Passenger capacity is usually defined in terms of the maximum number of passengers in the peak hour that can use a particular rapid transit corridor on the most congested section (or “link”) in the peak direction, or pphpd.
“Design” capacity assumes both a comfortable level of crowding inside the transit vehicle and a reasonable speed, which is usually defined as free flow traffic running speeds on the corridor.
The design capacity of a transit corridor is generally set based on the amount of passengers per hour per direction that either the most congested station can handle, or the most heavily used intersection, depending on where the bottleneck lies.
In BRT systems, capacity is, except in irregular circumstances, limited by the station. The typical limit on capacity is that too many buses with too many boarding and alighting passengers try to use a single station. If the next bus comes before the first bus has finished the boarding and alighting process, the next bus has to wait to enter the station, and a bus queue quickly develops. Intersections rarely represent the capacity constraint on a BRT system because many buses can queue at a traffic light like any other form of traffic, and there are only very rare instances where the bus volumes are so high they cannot clear a traffic light in a single signal phase. As such, in Chapter 7: System Speed and Capacity, the BRT capacity calculations are made based only on the capacity of the bottleneck station. Chapter 7 provides the calculations necessary to calculate the design capacity at a reasonable speed for BRT systems. Chapter 7 of this guide differs in some minor respects from the Bus chapter of the Transit Capacity and Quality of Service Manual, in ways that will be explained in the following text.
In rail systems it is more likely that capacity is set by some other bottleneck in the system, such as the intersection signal phase, the station platform length, insufficient number of vehicles, the signaling system, and so on. Therefore, the capacity calculation methodology in Chapter 7 does not work well for estimating the capacity of an LRT or HRT system, where there is a greater likelihood that the capacity constraint will lie elsewhere. The TCQSM considers not only the station capacity, it also considers other issues such as the traffic signal green time at the intersection with the longest signal phase, and operational control issues that can limit headway reductions. Therefore, for LRT and HRT system capacity estimation, we recommend following the guidance of the TCQSM (http://www.trb.org/Main/Blurbs/169437.aspx).
Many measures that are important to speed are not important to capacity. Exclusivity of the right-of-way, for instance, will affect system speeds but will not necessarily affect system capacity. Similarly, the number of station stops will significantly affect the speed of a transit system but not the capacity, as capacity is determined by the number of passengers that can pass through the bottleneck station at the peak hour. Restricting turning movements across the transitway is also critical to speed, but less critical to capacity.
For all transit systems, the same basic issues, discussed below, affect system capacity. Different system elements affect LRT, BRT, and HRT systems somewhat differently. It is these differences that determine the capacity differences between the three modes.
Vehicle Size and the Number of Doors
A transit station saturates and becomes the system bottleneck when the transit vehicles occupy the station more than 40 percent of the time. It is above 40 percent when queuing of transit vehicles occurs at the station. The faster passengers can board and alight, the more vehicles that can use a single station. The longer the vehicle, and the more doors that the vehicle has which passengers can board and alight through simultaneously, the more capacity that bottleneck station will have. A very long vehicle with only one or two doors will have no higher capacity than a much smaller vehicle because passengers tend to cluster around the doors. In TransJakarta, for instance, standard 12-meter buses were used that should have had a capacity of 90 passengers per bus, but because there was only one door, the buses operated at only about half capacity (45 passengers per bus). If passengers are only allowed to enter through the front door, because they need to pay the driver or for some other reason, then the capacity of the vehicle will be that of a much smaller vehicle with only one door. If the width of the door is less than one meter, the capacity is also compromised. As a result, all transit systems can carry more passengers if they have larger vehicles with multiple doors of 1 meter width or greater.
In general, the possibility exists of using larger vehicles with more doors in LRT systems and HRT systems than in BRT systems, though in most operational conditions this distinction does not matter for reasons that will be explained.
Table 2.5Table 2.5 Standard Vehicle Types and Capacities
| Vehicle Types | Vehicle Lengths | Doors | Vehicle Capacities | |
|---|---|---|---|---|
| Heavy Rail Large 8 car train | 176 | 24 | 1408 | |
| Heavy Rail Small 6 car train | 90 | 18 | 720 | |
| Heavy Rail Car Large | 22 | 3 | 176 | |
| Heavy Rail Car Small | 15 | 3 | 120 | |
| LRT Siemens Avino 8 module | 79 | 10 | 632 | |
| LRT Alstom Citadis Large | 49 | 8 | 392 | |
| LRT Siemens S70 Large | 36 | 4 | 288 | |
| LRT Alstom Citadis Small | 29 | 4 | 232 | |
| LRT Siemens small | 28 | 4 | 224 | |
| BRT Largest Bi-articulated | 25 | 5 | 220 | |
| BRT Volvo Bi-Articulated | 22 | 5 | 190 | |
| BRT Articulated | 18 | 4 | 150 | |
| BRT Standard | 12 | 2 | 90 |
The typical long HRT vehicle will have three doors per car and eight cars, so twenty-four doors, though eighteen doors or even fewer is also common. The longest LRT vehicles will have as many as ten doors, though most commonly LRT vehicles have four functional doors. The longest BRT biarticulated vehicles have five doors, but most BRTs use articulated buses with four doors, though some only have three, and 12-meter buses with two doors are also common.
The highest capacity transit vehicles have a door greater than 1 meter wide for every 5 meters of vehicle length.
For estimating the capacity of LRT vehicles, the TCSQM recommends:
When the specific vehicle type has not yet been selected (e.g., when planning a new rail system), vehicle length can be used as a proxy for the passenger capacity of a rail car. Passenger loadings for typical North American light rail cars range from 1.5 to 2.4 passengers per foot of car length (5.0 to 8.0 p/m length). The lower level of 1.5 passengers per foot length (5.0 p/m length)-with a standing space per passenger of 4.3 ft2 (0.4 m2)-corresponds to a standing load without body contact, while the upper level provides 3.2 ft2 (0.3 m2), corresponding to a standing load with some body contact.TCSQM, p. 8-66
For heavy rail, the 75-ft (23-m) cars used in more than twelve U.S. and Canadian cities range from 2.1 to 3.5 passengers per foot of car length (7.0 to 11.5 p/m of car length). The higher end of this range approaches crush-loaded conditions.continued
A reduction by 0.3 p/ft length (1.0 p/m length) should be used for smaller, narrower cars (1).continued
Table 2.5 uses eight passengers per meter of length to estimate the passenger capacity of a rail car.
The metro systems with the longest trains have eight-car trains, with six being more typical (for BRT systems, then, this guide uses \((L-3) * 10 \), or 10 passengers per meter, within the range of the TCSQM recommendation discounted by the 3 meters needed for the driver). These vehicles can all carry more passengers but they would be at crush loads and above the design capacity.
Where there are no cross streets to contend with, there is no definite limit on the length of the vehicle other than the platform length. Theoretically HRT systems can be built with ever-longer station platforms but there is rarely the demand to justify it.
For LRT systems, the definite limit on the length of an LRT vehicle is the commercial availability of vehicles, the distance between perpendicular streets (as the LRT vehicle cannot obstruct an intersection when stopped), and the required turning radius. Some more popular LRT vehicles are the Alstom Citadis, which range from 29 to 49 meters in length, the Siemens S70, which varies in length from 28 to 36 meters, and the 8 module Siemens Avino, which is 79 meters in length. All of them are between 2.4 and 2.6 meters in width. Many cities, such as New York City and Portland, Oregon, have block lengths of 61 meters (200 feet) or shorter in most of downtown, and with approaches to the station a maximum vehicle length would be less than 49 meters.
For BRT systems, the length of the vehicle is limited to the current technical capacity of a bus: the biarticulated bus that accommodates 220 passengers is a reasonable upward limit on BRT vehicle size.
Therefore, the capacity of LRT and HRT vehicles is larger than for BRT vehicles. As will be shown, however, this does not mean that LRT and HRT systems necessarily have higher capacity.
The Number of Bus Lanes or Rail Tracks
Most HRT, BRT, or LRT systems have only one bus lane or one set of rail tracks in each direction. A few LRT systems have one track shared in both directions for limited segments. This single lane puts significant constraints on the capacity of any system. When these systems get overcrowded, it is sometimes necessary to add a second lane. Double tracking or adding another lane in each direction makes possible more than doubling of capacity because it also makes possible the introduction of higher speed express services that do not stop at all stops.
Because it is generally cumbersome and slow to have trains switch tracks, the introduction of express services in HRT or LRT systems usually requires double tracking for the entire express portion of the service. All of the highest capacity HRT systems are quadruple tracked (two tracks in each direction). Quadruple tracking is little used in LRT systems except in short sections.
BRT systems have the advantage over HRT and LRT systems in that they do not need two full traffic lanes across the entire length of their corridor: they only need double lanes per direction at station stops. Two lanes at station stops allow express bus services to use the busways without getting caught behind local bus services at station stops. In addition, this allows one bus to pull around another bus in front of it that faces a delay due to boarding and alighting passengers. Because there are no tracks involved, no switches are required for one bus to pass another bus. As such, the right-of-way needed for two lanes is only required at station stops and not throughout the entire corridor. If stations are placed mid-block rather than at intersections, the passing lane of the busway can give way to additional mixed traffic turning lanes at the intersection.
Boarding and Alighting Time
Most of the elements that BRT borrowed from HRT and LRT systems, such as off-board fare collection, platform-level boarding, and simultaneous boarding through multiple wide doors, all reduce the amount of boarding and alighting delay at stations. In most systems, the bottleneck is a single station where high volumes of passengers consume a lot of time boarding and alighting, saturating the station. Hence, reducing the time it takes each passenger to board and alight at the bottleneck station is the most important thing to consider when trying to increase a system’s capacity.
This boarding and alighting time is sometimes called variable dwell time, as it will vary a lot in a corridor from one station to the next depending on the number of boarding and alighting passengers per station. Regardless of whether the system is an HRT, LRT, or BRT, for systems with the same design features, a system with very even distribution of boarding and alighting along it will achieve a much higher capacity than a system where boarding and alighting is heavily concentrated at a few stations.
The lower the boarding and alighting delay at stations, the less likely the bottleneck station will saturate, so the greater the capacity of the system.
There is no inherent advantage between BRT, LRT, or HRT for these measures: they can equally be applied to any of these modes.
Table 2.6Variable Dwell Times
| Mode | Seconds per passenger per door | |
|---|---|---|
| HRT & LRT Alighting at level | 1.39 - 2.0 | |
| HRT & LRT Alighting with Steps | 3.36 - 3.97 | |
| HRT & LRT Boarding at level | 1.11 - 2.61 | |
| HRT & LRT Boarding with Steps | 2.91 - 4.21 | |
| BRT Boarding TransMilenio | 1.2 | |
| Standard at - level BRT boarding | 1.6 |
Source: TCQSM, 3rd Edition, pp. 8–25, BRT Planning Guide
BRT systems, LRT systems, and HRT systems have very similar boarding and alighting times per passenger per door when they have a similar interface between the station and the vehicle. Therefore, in addition to the critical importance of having vehicles with more doors, as was discussed in the previous section, it is critical that payment takes place off-board so that boarding and alighting can take place through all doors simultaneously, and measures such as at-level boarding be implemented to reduce the amount of boarding and alighting time per passenger per door.
The Number of Substations and Docking Bays
In any rapid transit system, there may be one or more docking bays and one or more substations. If a station can accommodate two vehicles at the same time that do not need to pass each other, these are considered two docking bays (they are referred to as “loading areas” in the TCQSM). Having more than one docking bay in a single-track rapid transit station can help increase capacity somewhat as passengers can get on and off more than one vehicle at once, but there is a diminishing return after two docking bays, as a delay in boarding and alighting at the second docking bay will obstruct access to the first docking bay.
Sub-stops are specific to BRT systems. Sub-stops are docking bays in BRT stations with passing lanes where the docking bays are far enough apart that one bus can pull around the bus at a docking bay in front of it. Because buses, unlike trains, can easily pass one another, so long as there is a passing lane and the docking bays are far enough apart, a single station might have more than one substation. The largest stations in the largest BRT systems currently have three sub-stops and two docking bays at each sub-stop.
There are two main reasons that the TCQSM underestimates the potential capacity of a BRT system. The first is that it does not distinguish between sub-stops and docking bays (see TCQSM, Step 6a, Determining the number of effective loading areas, pp. 6–77). As such, it underestimates the possible number of effective loading areas. Though the TCQSM considers the possibility of five loading areas at a single stop, and estimates that on average about 190 buses can be accommodated before stations saturate if dwell times are 30 seconds or less (http://onlinepubs.trb.org/onlinepubs/tcrp/tcrp_rpt_165ch-06.pdf, p. 6.21), it rightly points out that at most three of them are effective because at some point a delay in boarding and alighting in the rearmost docking bay will block access to all of the remaining docking bays in front of it. This guide includes the possibility that, with passing lanes, six docking bays can be made effective. Chapter 7 of this guide thus provides capacity calculation and station saturation formulas that accept the possibility of up to six effective loading areas, if there are at least three sub-stops with two docking bays each, based on empirical observation of stations in Latin America.
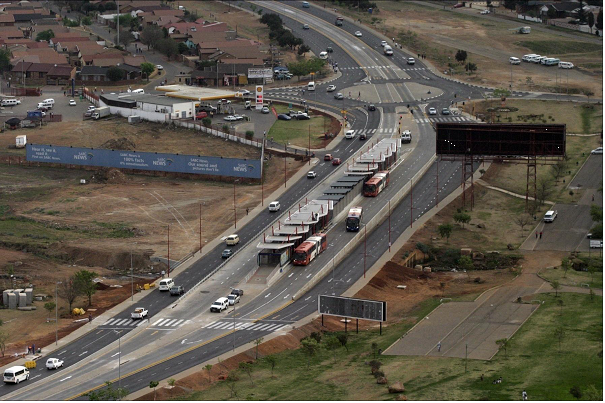
By having three sub-stops, each with two docking bays, or six effective loading areas, the number of doors per station stop that passengers will be able to board and alight from simultaneously increases. If a system were designed with six docking bays, and each docking bay were designed to accommodate biarticulated five-door buses, each station could theoretically board and alight passengers from thirty doors simultaneously—more than the largest metro trains. This possibility, not considered in the TCQSM, is why state-of-the-art BRT systems with passing lanes are reaching design capacities equivalent to those observed in multicar rail systems.
Because LRT and HRT systems cannot pass one another quickly on the same track, sub-stops are not used in LRT or HRT systems. Because sub-stops are not relevant to rail systems, the capacity of a rail system is limited to the capacity of the vehicle, the number of functional doors, and the achievable headway, unless fully double-tracked.
Services with Limited-Stop Options
If rapid transit infrastructure has been designed with two sets of tracks per direction (in the case of HRT or LRT) or with passing lanes and sub-stops at stations (in the case of BRT systems), then additional services that skip stops can be added. They can be added, however, at any time so long as the infrastructure to accommodate them has been built.
These limited-stop services increase the system’s capacity mainly because the demand on the corridor can be divided into multiple services, some of which bypass all together the bottleneck station. Because the capacity of a BRT system is limited by the critical bottleneck station, having all the buses stop at that station is not always a good idea. Often, some portion of the demand can be well served by services that bypass the bottleneck station. Detailed service planning calculations, as provided in Chapter 6, would need to be made in order to determine the optimal service patterns. The greater the number of limited-stop services that are able to bypass the bottleneck station, the greater the capacity of that station, because the additional dwell time for the share of the demand bypassing the station is zero. The enormous flexibility in providing limited-stop services for BRT systems with passing lanes and sub-stops is the other factor not measured in the TCQSM, and another reason why it underestimates the potential capacity of Gold Standard BRT systems.
Intersections
While HRT does not have to contend with intersections, both BRT and LRT systems have to accommodate perpendicular travel across them. Both BRT and LRT require similar measures to minimize the risk that intersections become a capacity constraint and source of delay.
There are two primary capacity constraints that intersections pose: station/signal interference, and signal phase limitations on headways. The first, station/signal interference, applies to both BRT and LRT systems. The second, signal phase limitations on headways, only affects LRT systems.
Station/signal interference is when a transit vehicle at a station is unable to clear the station because it is blocked by a red traffic signal, or when a transit vehicle cannot enter an unoccupied station because of a red traffic signal. This problem can occur regardless of whether the station is placed before or after the traffic signal.
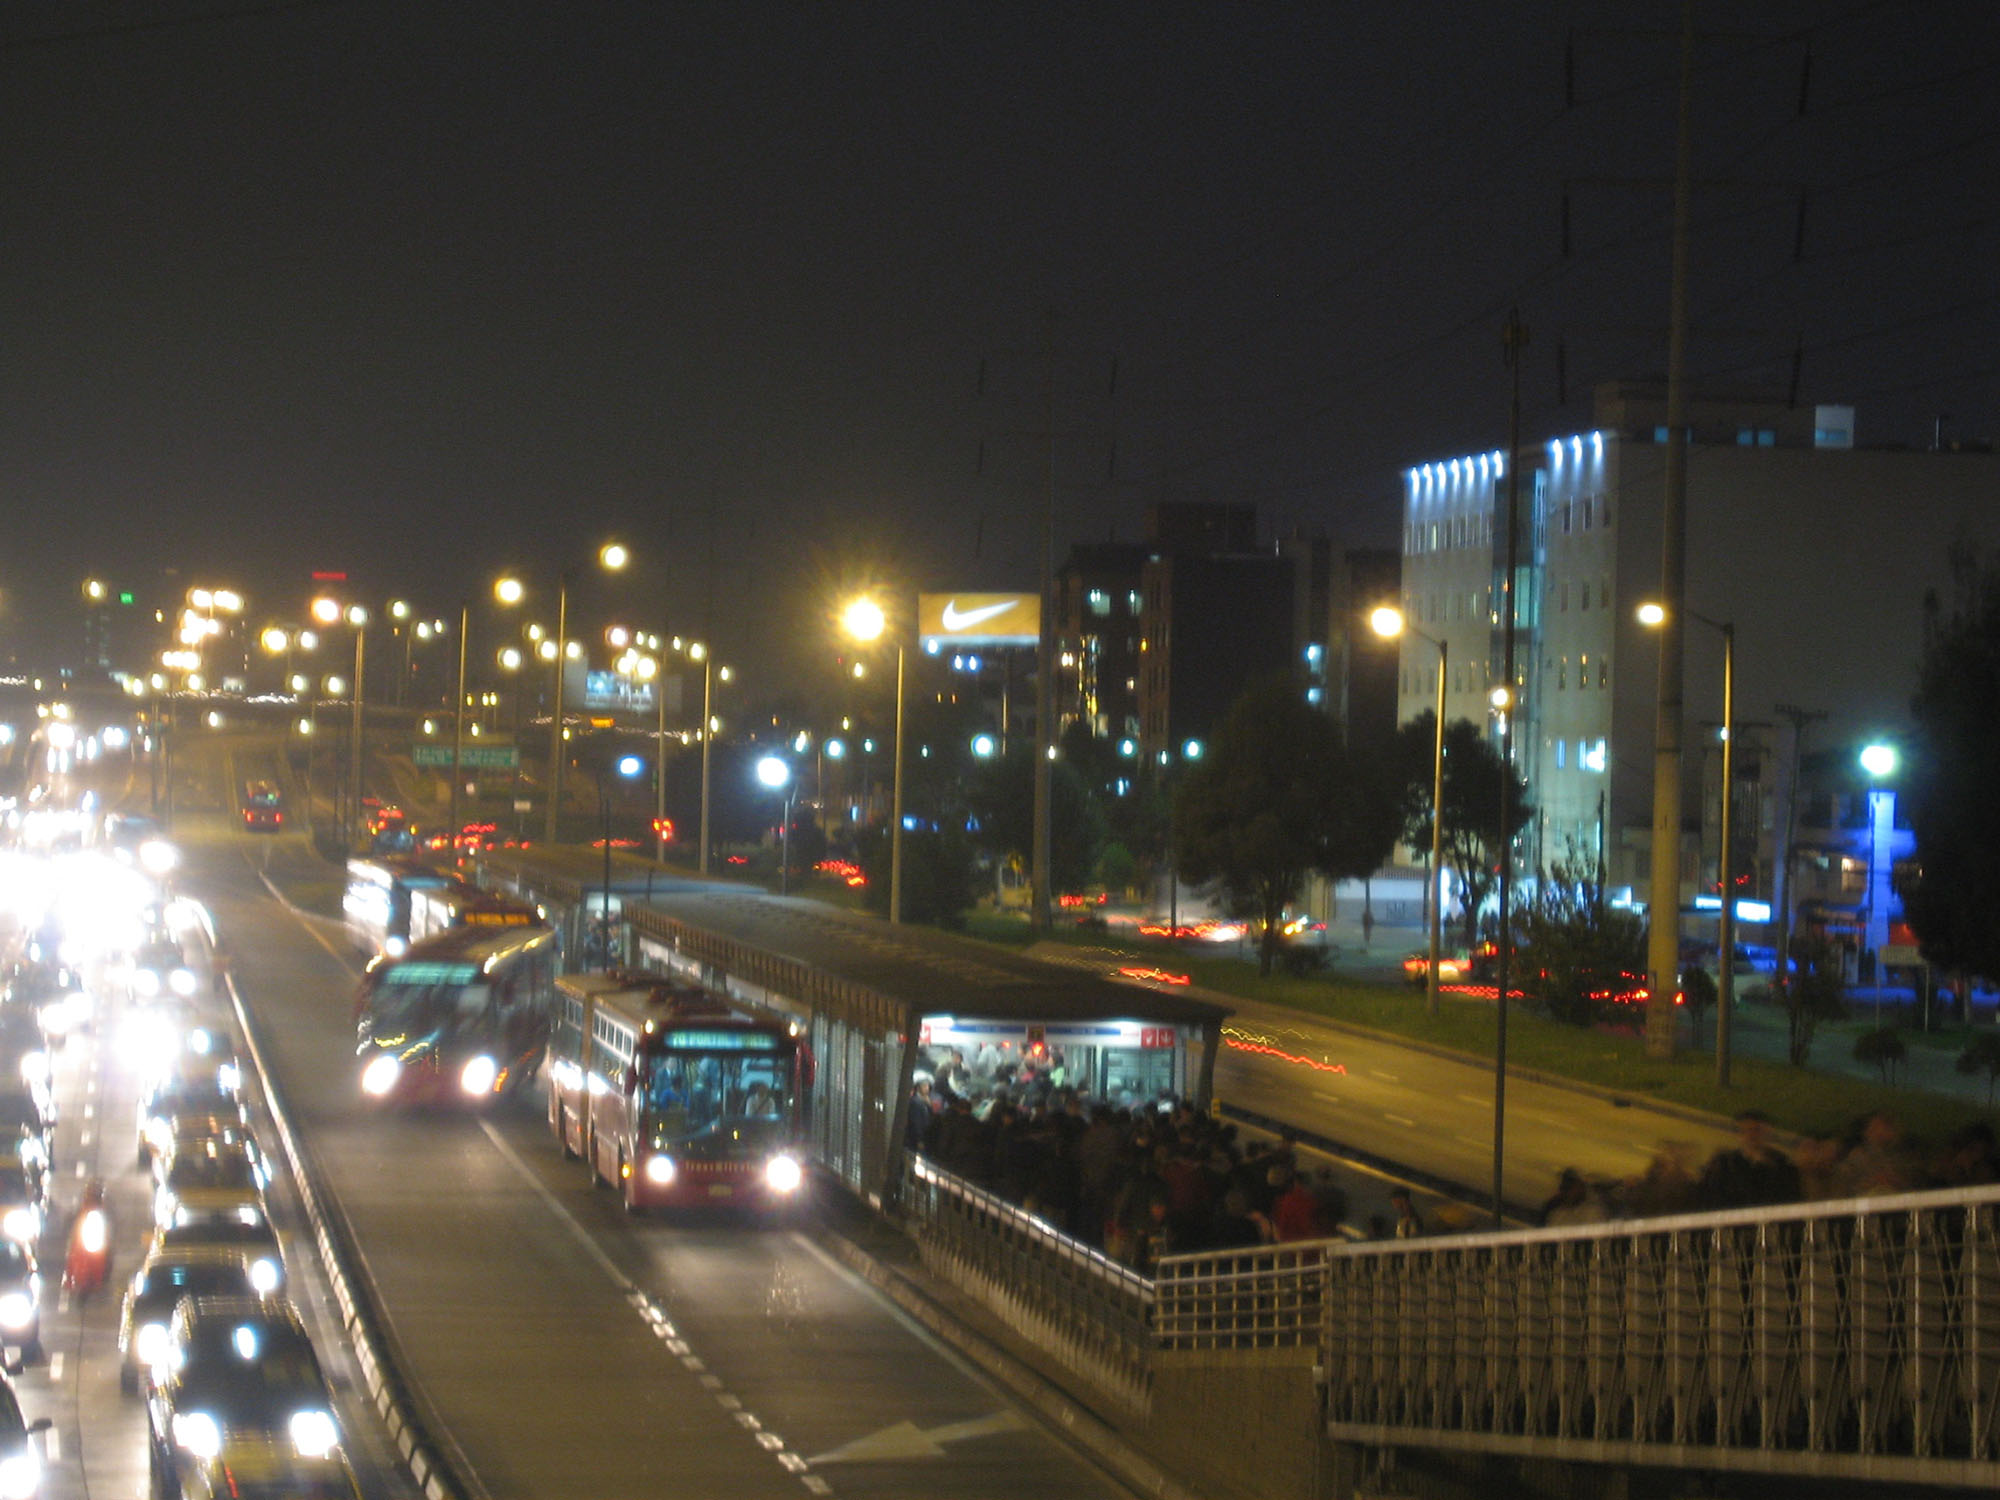
Boarding and alighting times are irregular, whereas signal phases are constant. If a boarding and alighting process takes longer than normal, and the station is immediately adjacent to the traffic signal, by the time the boarding and alighting process is completed, the signal may have changed to red, and the transit vehicle will be unable to clear the intersection. This then obstructs access to the transit station for the vehicles behind it. This problem is best avoided in the case of both BRT and LRT systems by separating the bus stop from the intersection by several vehicle lengths (The BRT Standard, http://brtstandard.org , p. 34). The greater the frequency, the more vehicle lengths that will be necessary. In the case of close downtown streets, it may be necessary to eliminate intersections all together, as was done on Caracas Avenue in downtown Bogotá.
As demand grows to ranges where capacity is being reached, the risk, for both BRT and LRT, of there being interference between the signal phase and the boarding and alighting process grows. The longer an LRT vehicle, the more doors in which to minimize dwell times from boarding and alighting, but at the same time, there is less space to separate the transit stop from the intersection so that two vehicles can clear an intersection in a signal phase if necessary. Similarly, in BRT systems, the greater the frequency of buses, the longer the distance needed between the intersection and the station.
Station/intersection interference can significantly reduce the capacity of either a BRT or LRT system. So long as this issue is addressed in the design, large numbers of buses can easily pass through a single green signal phase of any standard length at any intersection. As such, the capacity calculations for BRT systems in Chapter 7 do not consider intersections as the critical bottleneck.
For LRT systems, however, the length of the full signal phase at an intersection is also a capacity constraint. This is because train sets require much longer minimum headways between them. The rule of thumb for minimum sustainable headways in LRT systems is one train per traffic signal cycle if the right-of-way is fully protected from encroachment from turning vehicles of mixed traffic, and there is no interference between the boarding and alighting process and the signal phase. However, these conditions are rarely fully achieved in most LRT systems. For this reason, TCQSM states the following:
Therefore, a common rule of thumb is that the minimum sustainable headway is double the longest traffic signal cycle on the on-street portions of the line.TCQSM pp. 8–57
As this problem does not manifest itself in BRT systems, they are not considered in Chapter 7. For this reason, the TCQSM is a better manual for calculating the likely capacity of an LRT system. It should be emphasized, however, that the potential capacity of LRT systems in the TCQSM may still be exaggerated as there are no street-level LRT systems with capacities of over 6,000 upon which to base formulas for calculating the capacity of an LRT.
Both BRT and LRT generally benefit from shorter signal phases, but for LRT systems shorter signal phases are critical to achieving higher capacity, as the signal phase is likely to be the bottleneck. It is fairly typical in lower income countries for signal phases to extend upward of four minutes, and traffic police are notoriously resistant to shortening signal phases. If an LRT is introduced into a corridor with a four-minute signal phase, the minimum achievable headway in most typical operational conditions will be eight minutes. In higher income countries, it is more typical that signal phases on a rapid transit corridor are kept to a maximum of two minutes. This means that for LRT, a reasonable estimate of the minimum headway is likely to be four minutes, or fifteen train sets per hour.
Comparative Capacities
There are two ways of comparing the capacity of HRT, LRT, and BRT:
- Theoretical capacity, based on reasonable expectations given corridor conditions at reasonable minimum speeds (free flow speeds in mixed traffic lanes as an upward limit), with reasonable occupancy levels (no crush loads);
- Observed capacities.
Both have their advantages and disadvantages. Theoretical values can, of course, make false assumptions. Observed values often fail to take into consideration that a system may be operating at below optimal speeds or with passenger overcrowding or with demand below capacity. Thus, observed capacities may be greater than design capacity, or below design capacity as is often the case in the United States, or they could face constraints unanticipated by theoretical design capacity calculations, like a demand profile with heavy boarding and alighting concentrated at a few critical stops.
Table 2.7Table 2.7 Theoretical Capacities of Different Rapid Transit Alternatives
| Vehicle capacity | Load Factor | Frequency | Capacity | ||
|---|---|---|---|---|---|
| HRT 8 car single track, best signaling system | 1408 | 0.85 | 30 | 35904 | |
| HRT 8 car double track | 1408 | 0.85 | 60 | 71808 | |
| LRT 8 module, no turning restrictions, 2-minute signal | 632 | 0.85 | 15 | 8058 | |
| LRT 8 module, no turns allowed, 90 second signal* | 632 | 0.85 | 20 | 10744 | |
| LRT 8 module double track | 632 | 0.85 | 40 | 21488 | |
| BRT largest bi-articulated | 220 | 0.85 | 60 | 11220 | |
| BRT with passing lanes | 220 | 0.85 | 193 | 36000 | |
| BRT with passing lanes & limited stops bypassing bottleneck station | 220 | 0.85 | 241 | 45000 |
*TCQSM 3rd Edition p 8-87 provides 20 as the number of trains that can be processed at grade with a 90 second signal. They reach a capacity of 12,000 pphpd by assuming trains with larger capacity than is commercially available or operable in most on-street contexts.
The theoretical values used above are illustrative only, and local circumstances will cause significant deviations from these values.
In Table 2.7, the vehicle capacities are based on existing commercial vehicles operated in fairly typical conditions without crush loads. The longest HRT trains are 176 meters with 8-car trains. At 8 passengers per meter of length, this is 1,408 passengers per train. The longest LRT vehicles are 8 modules and 79 meters long, and have a capacity of about 632 passengers per train. This is longer than is possible to operate in many cities like New York and Portland, which have block lengths of 61 meters. The longest biarticulated BRT vehicles in North America are 25 meters and have a capacity of about 220 passengers per bus without overcrowding.
The frequency of HRT systems was set based on the TCQSM recommendation that no more than thirty trains per hour are possible even in fully grade-separated systems with state-of-the-art signaling systems due to extended dwell times at high-demand stations. It reads:
It is apparent from the observed operating experience in New York and Washington that higher dwell times at critical stations prevent the achieving of capacities significantly greater than 30 trains per hourTCQSM, pp. 8–83
The frequency of LRT systems is similarly set by TCQSM guidelines for on-street systems, which recommends that twenty train sets per hour is the maximum achievable frequency for systems with a signal phase maximum of ninety seconds.
The achievable frequency of BRT systems is set based on observations in high-demand systems in Latin America. As four or more buses can easily pass through a single signal phase, the intersection is rarely the constraint. Until the introduction of off-board fare collection, at-level boarding, simultaneous multiple door boarding, and biarticulated buses into Curitiba’s busway, it was thought that busways could only operate in a range up to about 5,000 pphpd at speeds around 20 kilometers per hour. It was only with the simultaneous introduction of all these measures in Curitiba that capacities approaching 12,000 pphpd were reached with busways, and BRT was born. Even with these measures, however, as demand rises upward of 8,000 pphpd, there are usually a few critical stations that will bottleneck in most real-world conditions. Using bus platooning, where three articulated buses were timed to approach and depart from station stops nearly simultaneously, mimicking a longer vehicle, capacities of around 16,000 pphpd were briefly achieved, but this proved hard to sustain as it required sophisticated operational controls and driver training.
It was only with the introduction of passing lanes on the Santa Amaro Corridor in São Paulo, and later with TransMilenio’s passing lanes and sub-stops in Bogotá, combined with the use of multiple limited-stop services in the corridor, that transit engineers were able to reach capacities that compete with HRT systems and significantly surpass LRT systems. Bogotá’s BRT system, with a specific mix of multiple limited-stop services, passing lanes at stations, and multiple sub-stops, was designed to accommodate 36,000 pphpd, the current record. It is believed that once the TransBrasil BRT system in Rio de Janeiro opens (projected for 2018), that design capacities of over 45,000 will be achieved, due to limited intersections and a unique demand profile, which allows for an unprecedented majority of services to run very limited stops.
Table 2.8Passengers per Hour per Peak Direction Observed: BRT
| Corridor | Type | Daily Weekday Ridership | PPHPD | Level | Tracks/ Lanes | Source |
|---|---|---|---|---|---|---|
| BRT | ||||||
| Bogotá | BRT | 1200000 | 37,700 | Surface | 2 | # |
| Guangzhou | BRT | 850000 | 27,400 | Surface | 2 | # |
| Brisbane | BRT | 19,900 | Surface | 2 | @ | |
| Istanbul | BRT | 600000 | 18,900 | Highway | 1 | # |
| Porto Alegre | BRT | 15,800 | Surface | 2 | @ | |
| Guayaquil, EC | BRT | 15,000 | Surface | 2 | @ | |
| Rio de Janeiro TransOeste | BRT | 14,000 | surface | 2 | @ | |
| Lima | BRT | 350000 | 13,950 | Highway | 2 | # |
| Guatemala City, Eje Sur | BRT | 13,500 | Surface | 2 | @ | |
| Curitiba- Eixo Sul | BRT | 12,500 | Surface | 1 | @ | |
| Quito | BRT | 11,700 | Surface | 2 | @ | |
| Cali | BRT | 11,100 | Surface | 2 | # | |
| Ottawa West Transitway | BRT | 10,000 | Surface | 1 | @ | |
| Merida | BRT | 9,000 | Surface | 2 | @ | |
| Guadalajara | BRT | 9,000 | Surface | 1 | @ | |
| Xiamen | BRT | 8,360 | Elevated | 1 | # | |
| Brisbane | BRT | 7,700 | Surface | 2 | # | |
| Mexico City | BRT | 7,550 | Surface | 1 | # | |
| Zhengzhou | BRT | 7,230 | Surface | 1 | # | |
| Urumqi | BRT | 6,230 | Surface | 1 | # | |
| Chengdu | BRT | 6,650 | Elevated | 1 | # | |
| Lanzhou | BRT | 290000 | 6,550 | Surface | 2 | # |
| Dalian | BRT | 6,430 | Surface | 1 | # | |
| Hangzhou | BRT | 6,300 | Surface | 1 | # | |
| São Paulo - Espresso Tiradentes | BRT | 6,100 | Elevated | 1 | @ | |
| Quito | BRT | 6,000 | Surface | 1.5 | # | |
| Baranquilla | BRT | 5,900 | Surface | 2 | @ | |
| Delhi | BRT | 5,500 | Surface | 2 | @ | |
| Johannesburg | BRT | 4,510 | Surface | 2 | # | |
| Bucaramanga, Co | BRT | 4,525 | Surface | 1 | @ | |
| TransSantiago | BRT | 4,400 | Surface | 1 | @ | |
| Pereira, Co | BRT | 4,073 | Surace | 1 | @ | |
| Hefei | BRT | 3,600 | Surface | 1 | # | |
| Yinchuan | BRT | 3,600 | Surface | 1 | # | |
| Buenos Aires Juan B. Justo | BRT | 3,450 | Surface | 1 | @ | |
| Jakarta | BRT | 3,400 | Surface | 1 | # | |
| Paris Val de Marn | BRT | 3,000 | Surface | 1 | @ | |
| Beijing | BRT | 2,750 | Surface | 1 | # | |
| Changzhou | BRT | 2,650 | Surface | 1 | # | |
| Medellin, CO | BRT | 2,450 | Surface | 1 | @ | |
| Los Angeles Orange Line | BRT | 33,000 | 2,357 | Surface | 2 | * |
| Jinan | BRT | 2,050 | Surface | 1 | # | |
| Nantes, France | BRT | 2,000 | Surface | 1 | @ | |
| Leon, MX | BRT | 1,950 | Surface | 1 | # | |
| Ahmedabad | BRT | 1,780 | Surface | 1 | @ | |
| Pittsburgh Martin Luther King, Jr. East Busway | BRT | 24,000 | 1,714 | Surface | 2 | * |
| Lianyungang | BRT | 1,650 | Surface | 1 | # | |
| Zaozhuang | BRT | 1,400 | Surface | 1 | # | |
| Yancheng | BRT | 1,300 | Surface | 1 | # | |
| Bangkok | BRT | 1,200 | Surface | 1 | # | |
| Nantes | BRT | 1,200 | Surface | 1 | # | |
| Las Vegas Strip & Downtown Express (SDX) BRT | BRT | 16,789 | 1,199 | Surface | 1 | * |
| Cleveland HealthLine BRT | BRT | 15,800 | 1,129 | Surface | 1 | * |
| Eugene Emerald Express Green Line (EmX) BRT | BRT | 10,000 | 714 | Surface | 1 | * |
| Pittsburgh South Busway BRT | BRT | 9,262 | 662 | Surface | 1 | * |
| Pittsburgh West Busway BRT | BRT | 8,419 | 601 | Surface | 1 | * |
| Las Vegas Metropolitan Area Express (MAX) | BRT | 7,400 | 529 | Surface | 1 | * |
Sources:
- + Taken from TCQSM 2nd Ed, Annex. http://onlinepubs.trb.org/onlinepubs/tcrp/tcrp100/part%205.pdf, p. 5 - 123
- * Extrapolated from daily demand collected by ITDP for https://www.itdp.org/more-development-for-your-transit-dollar-an-analysis-of-21-north-american-transit-corridors/ using a ratio of 1/14 derived from TCQSM 2nd Ed data
- # Counted by ITDP China staff, from: http://www.chinabrt.org/en/cities/param-quan.aspx?param=2
- & Taken from TCQSM 2nd Ed. Part 2: Transit in North America, p. 2-13
- @ http://brtdata.org/indicators/corridors/peak_load_corridor_passengers_per_hour_per_direction
- ? BRT Planning Guide, 2007
The other way to compare the relative capacities of BRT, LRT, and HRT systems is to look at observed actual ridership per hour per direction on the highest demand link. The tables above and below are compilations of the most reliable data that the authors could collect.
The observed pphpd on two BRT systems now exceeds 20,000 (Bogotá, Guangzhou).
Table 2.9Passengers per Hour per Peak Direction Observed: LRT and HRT
| Corridor | Type | Daily Weekday Ridership | PPHPD | Level | Tracks/ Lanes | Source |
|---|---|---|---|---|---|---|
| LRT | ||||||
| Tunis- LRT | LRT | 13,400 | Underground Junctions | 1 | ? | |
| Calgary | LRT | 60200 | 5,900 | Surface | 1 | + |
| Portland MAX Blue Line LRT | LRT | 66,370 | 4,741 | Surface | 1 | * |
| Denver Central Corridor LRT | LRT | 62,782 | 4,484 | Surface | 1 | * |
| Edmonton | LRT | 38000 | 3,800 | Surface | 1 | + |
| Phoenix Metro LRT | LRT | 41,784 | 2,985 | Surface | 1 | * |
| Pittsburgh "The T" LRT | LRT | 28,232 | 2,017 | Surface | 1 | * |
| Toronto Spadina | LRT | 40200 | 2,000 | Surface | 1 | + |
| Newark | LRT | 16900 | 1,800 | Surface | 1 | + |
| Sacramento | LRT | 29000 | 1,500 | Surface | 1 | + |
| Charlotte Lynx LRT | LRT | 14,000 | 1,000 | Surface | 1 | * |
| Denver Southwest Corridor LRT | LRT | 17,746 | 1,268 | Surface | 1 | * |
| Seattle South Lake Union (SLU) Streetcar | LRT | 3,000 | 214 | Surface | 1 | * |
| Portland Streetcar | LRT | 11,400 | 814 | Surface | 1 | * |
| HRT | ||||||
| Hong Kong- Subway | HRT | 84,000 | Underground | 2 | ? | |
| São Paulo - Line 1 | HRT | 60,000 | Underground | 2 | ? | |
| NYC Green Lines Combined | HRT | 56,100 | Underground | 2 | + | |
| Santiago- La Moneda | HRT | 36,000 | Underground | 1 | ? | |
| NYC 4,5, express trains | HRT | 30,200 | Underground | 1 | + | |
| Toronto Spadina | HRT | 614000 | 26,200 | Underground | 1 | + |
| Manila- MRT-3 | HRT | 26,000 | Elevated | 1 | ? | |
| NYC 6 train | HRT | 25,900 | Underground | 1 | + | |
| London- Victoria Line | HRT | 25,000 | Underground | 1 | ? | |
| Montreal | HRT | 407700 | 24,400 | Underground | 1 | + |
| Bangkok- SkyTrain | HRT | 22,000 | Elevated | 1 | ? | |
| Buenos Aires- Line D | HRT | 20,000 | Underground | 1 | ? | |
| Newark Path | HRT | 126800 | 17,800 | Underground | 1 | + |
| Washington DC Red | HRT | 12,700 | Underground | 1 | + | |
| Chicago Red | HRT | 200200 | 11,900 | Elevated | 1 | + |
| San Fran BART | HRT | 124300 | 6,200 | Underground | 1 | + |
| Atlanta | HRT | 117,000 | 5,100 | Underground | 1 | + |
Sources:
- + Taken from TCQSM 2nd Ed, Annex. http://onlinepubs.trb.org/onlinepubs/tcrp/tcrp100/part%205.pdf, p. 5 - 123
- * Extrapolated from daily demand collected by ITDP for https://www.itdp.org/more-development-for-your-transit-dollar-an-analysis-of-21-north-american-transit-corridors/ using a ratio of 1/14 derived from TCQSM 2nd Ed data
- # Counted by ITDP China staff, from: http://www.chinabrt.org/en/cities/param-quan.aspx?param=2
- & Taken from TCQSM 2nd Ed. Part 2: Transit in North America, p. 2-13
- @ http://brtdata.org/indicators/corridors/peak_load_corridor_passengers_per_hour_per_direction
- ? BRT Planning Guide, 2007
In fact, the highest observed capacity on TransMilenio exceeds all but the highest capacity HRT systems, and it far exceeds the highest LRT system. The highest observed capacity BRT systems all have passing lanes at virtually every station. The highest single-lane BRTs and LRTs (Istanbul and Tunis, respectively) both operate on dedicated roads or rights-of-way that overpass or underpass intersections and distances between stations longer than generally recommended for urban areas. The highest capacity single-lane BRT systems (Curitiba, Mexico City) both operate in very congested conditions. Virtually all of the BRT systems with passing lanes have a design capacity much higher than observed capacity.
A number of new BRT systems are now under construction, such as Rio de Janeiro’s TransBrasil line, which may break TransMilenio’s observed capacity record, mainly because the demand profile calls for a higher percentage of limited-stop services than was appropriate in Bogotá. The Hong Kong and São Paulo metro systems also operate under crush load conditions, so the observed capacity is higher than the theoretical design capacity.
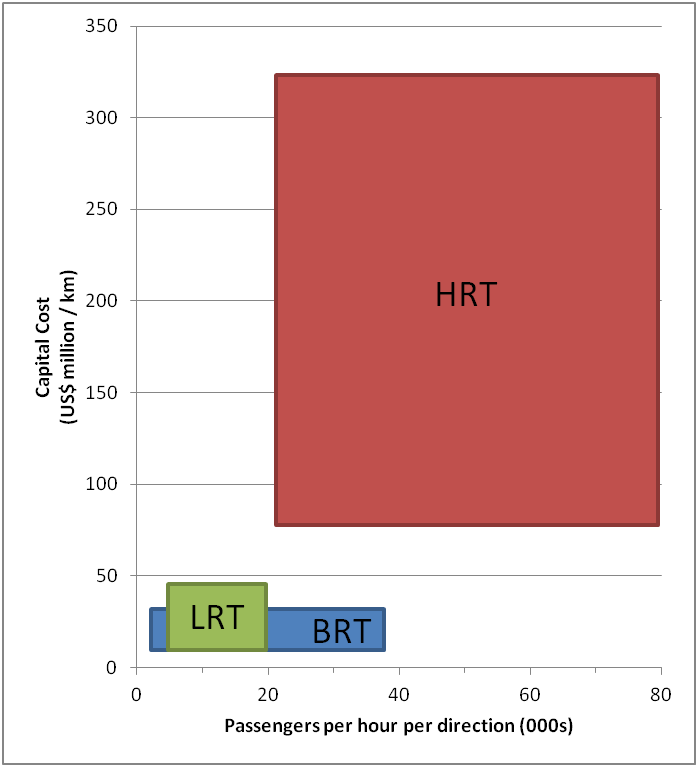
The different sized areas of the rectangles in Figure 2.12 are also revealing with regard to the relative risk and overall flexibility of each transit technology option. Ideally, a technology will have a small band of possible capital cost levels (y-axis) and a wide band of profitable capacity operations (x-axis). In other words, a system that minimizes costs and maximizes the spectrum of profitable operating conditions provides the most cost-effective and flexible solution. The range of capital costs (y-axis) can also be interpreted as an indication of the potential risk and uncertainty involved in implementing the particular project.
The fact that Bogotá’s TransMilenio and Guangzhou’s BRT both function well in cities with more than eight million inhabitants, and with population densities of greater than 260 inhabitants per hectare, says much about BRT’s potential in other megacities. To achieve these capacities, road space sufficient for passing lanes at stations needs to be provided. This is generally not as difficult politically as it would seem, because if current transit demand on a corridor is high enough to require a BRT with passing lanes to avoid saturating, the existing buses or minibuses are already consuming much of the road reserve and causing traffic congestion, particularly at bus stops. A standard 12-meter (40 foot) bus is generally considered at capacity at around 90 passengers, and if a corridor has 36,000 passengers per direction in the peak hour, that means that 400 buses an hour are already passing one way down that corridor. That 400 buses an hour already consumes more than 2 full lanes of road space, and frequently more at transit stations, so putting these buses onto a BRT system will often help decongest the remaining traffic lanes. This was the case in both Bogotá and Guangzhou.
Systems in cities such as Curitiba, Mexico City, and Quito that utilize just one lane in each direction can reach capacities of approximately 8,000 to 10,000 pphpd before they face crush loads. In general, then, it is reasonable to assume that a BRT or LRT operating on a dedicated single lane will achieve approximately equal capacity levels. For most corridors in most cities, these capacity levels are sufficient to meet the projected demand. Unlike LRT, however, BRT is still a viable option for cities with demand of up to nearly 38,000 pphpd, but only if Bogotá-type passing lanes, sub-stops, and express services are introduced.
2.4.2System Speeds and Operations
The factors that determine the speed of a BRT, LRT, and HRT system are:
- The distance between station stops;
- The level of encroachment onto the transit-way;
- Boarding and alighting times per passenger;
- Passenger volumes (the more, the slower);
- Transit-way saturation (usually results from design flaws or service planning problems);
- The level of priority at traffic signals;
- The number of limited-stop services.
HRT systems have an inherent advantage in terms of minimizing encroachment onto the transit-way and traffic signal delay, as they are fully grade separated, whether elevated or underground. Elevated or underground BRT systems, or those on highways, enjoy similar advantages.
The other mode-specific way of increasing speeds is through increasing the number of limited-stop services. BRT systems with passing lanes and sub-stops can add limited-stop services of a great variety at any time, while they are largely unknown in LRT systems and need to be built into quadruple track metro systems from inception. While it only occasionally makes sense to add limited-stop services to low-demand corridors, in high-demand corridors limited-stop services are a key competitive advantage of BRT in terms of speed. Some LRT and some single-track BRT systems (Curitiba, for instance) operate express bus services parallel to the BRT in mixed traffic, and at speeds higher than the BRT. One reason that TransMilenio’s average speed is 29 kilometers per hour and Curitiba’s is 20 kilometers per hour is because TransMilenio services include extensive limited-stop service options, although some speed increases are due to a limited number of intersections with crossing traffic. Pittsburgh’s BRT also enjoys high speeds due in part to express services, but the system also benefits from grade separation and large distances between stations.
Other than these two factors, all the other determinants of speed are either pre-determined by the demand characteristics of the corridor, or addressed by the same measures. The number of station stops, the boarding and alighting volumes at each stop, the number of intersections, and the level of priority at these intersections should generally be determined in the same way regardless of whether the rapid transit technology is LRT or BRT. Central median alignment, at-level boarding, off-board fare collection, turning restrictions across the busway, and separation of the station from the intersection will all tend to increase speeds in a similar manner, whether a BRT or an LRT.
In most rapid transit systems, a vehicle’s speed alone (maximum speed, rate of acceleration and deceleration) does not matter much, as transit vehicles can usually accelerate and decelerate faster than is comfortable for passengers, and they are normally able to move faster than traffic rules on normal streets would allow.
Table 2.4.2 shows the average speeds of various BRT, LRT, and HRT systems around the world. It is clear from the table that BRT and LRT operate at very similar speeds, and the variance is almost entirely explained by corridor characteristics, with the existence of express services and grade separation in Ottawa, Pittsburgh, and Bogotá giving BRT a slight advantage in a like-to-like comparison.
Table 2.10Comparative Observed Speeds, BRT, LRT, and HRT
| Corridor | Type | Speed (km/hr) | Source |
|---|---|---|---|
| BRT | |||
| Pittsburgh West Busway Pennsylvania, | BRT | 54 | [ii] |
| Pittsburgh Martin Luther King, Jr. East Busway | BRT | 54 | [x] |
| Pittsburgh South Busway, Pennsylvania, | BRT | 54 | [iii] |
| Ottawa Transitway, Canada | BRT | 52 | [i] |
| Orange Line, Los Angeles | BRT | 32 | [v] |
| Bogotá, Colombia, TransMilenio | BRT | 27 | [x] |
| Curitiba, Brazil, Linha Verde | BRT | 25 | [x] |
| Beijing (Lines 1, 2, 3, 4) | BRT | 24 | [iv] |
| Ahmedabad, India, Janmarg | BRT | 24 | [x] |
| Guangzhou, China, GBRT | BRT | 23 | [x] |
| Las Vegas Metropolitan Area Express (MAX) | BRT | 22 | [x] |
| Curitiba, Brazil, RIT corridors | BRT | 18 | [x] |
| Los Angeles OrangeLine | BRT | 18 | [x] |
| Cleveland HealthLine | BRT | 18 | [x] |
| Mexico City, Mexico, Insurgentes | BRT | 17 | [x] |
| Eugene Emerald Express Green Line (EmX) | BRT | 17 | [x] |
| LRT | |||
| Sound Transit Central Link, Seattle, Washington, USA | LRT | 40 | [vi] |
| Ottawa O-Train | LRT | 40 | [x] |
| LYNX Blue Line, Charlotte, North Carolina, USA | LRT | 37 | [vi] |
| Portland MAX Blue Line LRT | LRT | 30 | [x] |
| Denver Central Corridor LRT | LRT | 23 | [x] |
| Denver Southwest Corridor LRT | LRT | 23 | [x] |
| Phoenix Metro LRT | LRT | 19 | [x] |
| Budapest, Hungary, Grand Boulevard LRT | LRT | 18 | [x] |
| Portland Streetcar | LRT | 16 | [x] |
| Seattle South Lake Union (SLU) Streetcar | LRT | 8 | [x] |
| HRT | |||
| Manila MRT 3 (Metrostar Express), Philippines | HRT | 48 | [viii] |
| Expo/Millennium Lines, Vancouver, Canada | HRT | 43.5 | [vii] |
| Tren Urbano, San Juan, Puerto Rico | HRT | 33.2 | [ix] |
Sources:
- [i]Ottawa Ontario BRT Case Study." Transportation Research Board. http://onlinepubs.trb.org/onlinepubs/tcrp/tcrp90v1_cs/Ottawa.pdf.
- [ii] US Department of Transportation. Evaluation of Port Authority of Allegheny County’s West Busway Bus Rapid Transit Project. Washington DC, 2003. Report No. FTA-PA-26-7010-03.1 http://www.fta.dot.gov/documents/Pittsburgh_West_Busway_BRT_Evaluation-April_2003.pdf
- [iii] "Pittsburgh, Pensylvania South, East, and West Busways." Transportation Research Board. http://onlinepubs.trb.org/onlinepubs/tcrp/tcrp90v1_cs/Pittsburgh.pdf
- [iv] National BRT Institute. "Perspectives on Bus Rapid Transit (BRT) Developments in China." Presentation. National BRT Institute. May 1, 2006. http://www.nbrti.org/docs/pdf/Darido_China BRT_051106_presentation.pdf
- [v] Flynn, Jennifer, Cheryl Thole, Victoria Perk, Joseph Samus, Caleb Van Nostrand, National Bus Rapid Transit Institute, and Center for Urban Transportation Research. Metro Orange Line BRT Project Evaluation. Vol. 0004. Washington DC: Federal Transit Administration, 2011. http://www.fta.dot.gov/documents/FTA_Research_Report_0004_FINAL_2.pdf
- [vi] Speeds for Charlotte Lynx, Central Link, and WMATA Silver line calculated from posted schedules.
- [vii] "Vancouver SkyTrain—A Proven Success Story."Japan Railway & Transport Review, no. 16 (1998): 44-45. http://www.jrtr.net/jrtr16/pdf/f44_vancouver.pdf
- [viii] Antiporda, Jefferson. "DOTC Promises Better MRT Service next Year." Manila Times, August 15, 2014.http://www.manilatimes.net/dotc-promises-better-mrt-service-next-year/119302/.
- [ix] "Subways of Puerto Rico." My Transit Guide. http://mapa-metro.com/en/Puerto Rico/San Juan/San Juan-Tren-Urbano-map.htm.
- [x] "More Development for your transit dollar", 2013 ITDP. https://www.itdp.org/more-development-for-your-transit-dollar-an-analysis-of-21-north-american-transit-corridors/, derived from interviews with transit authority staff.
2.4.3Reliability
Reliability refers to the level of confidence one has in the public transport system’s ability to perform. An unreliable service can create a high degree of personal stress—for instance, if a customer does not know when or if a vehicle is going to arrive at a station. Unreliable services ultimately lead to non-captive users seeking more reliable and predictable travel options, such as private vehicles.
Each type of public transport system has different characteristics with regard to reliability. On-time performance, the frequency of service breakdowns, the rate at which disabled vehicles can be replaced, and the operational responsiveness to changes in demand all affect overall reliability. Metros, LRTs, and BRTs all have excellent records of reliability, particularly when compared to more conventional public transport services. Segregated rights-of-way help better control service frequencies and headways between vehicles, as vehicles are less likely to be stuck in traffic. Systems with complete grade separation, such as underground metros, have a particular advantage in terms of avoiding unforeseen incidents at intersections and general traffic congestion.
The relative flexibility of BRT vehicles to operate inside and outside of the segregated infrastructure allows immediate adjustments to breakdowns. Service can continue while repairs or removals are taking place. The breakdown of a metro or LRT vehicle, however, can require significant additional time for remedial actions. Until the disabled vehicle is cleared from the system, there can be disruption to service and thus to reliability.
2.4.4Comfort
The level of comfort within a system depends on many design characteristics that are independent of mass transit mode, including station seating and protection from the elements. Underground stations have the advantage of a better natural barrier from outside weather conditions, but many people prefer to stay on the surface and see the city. The interior design of the vehicles is also dependent on design specifications and can be of equal quality for either rail or BRT services.
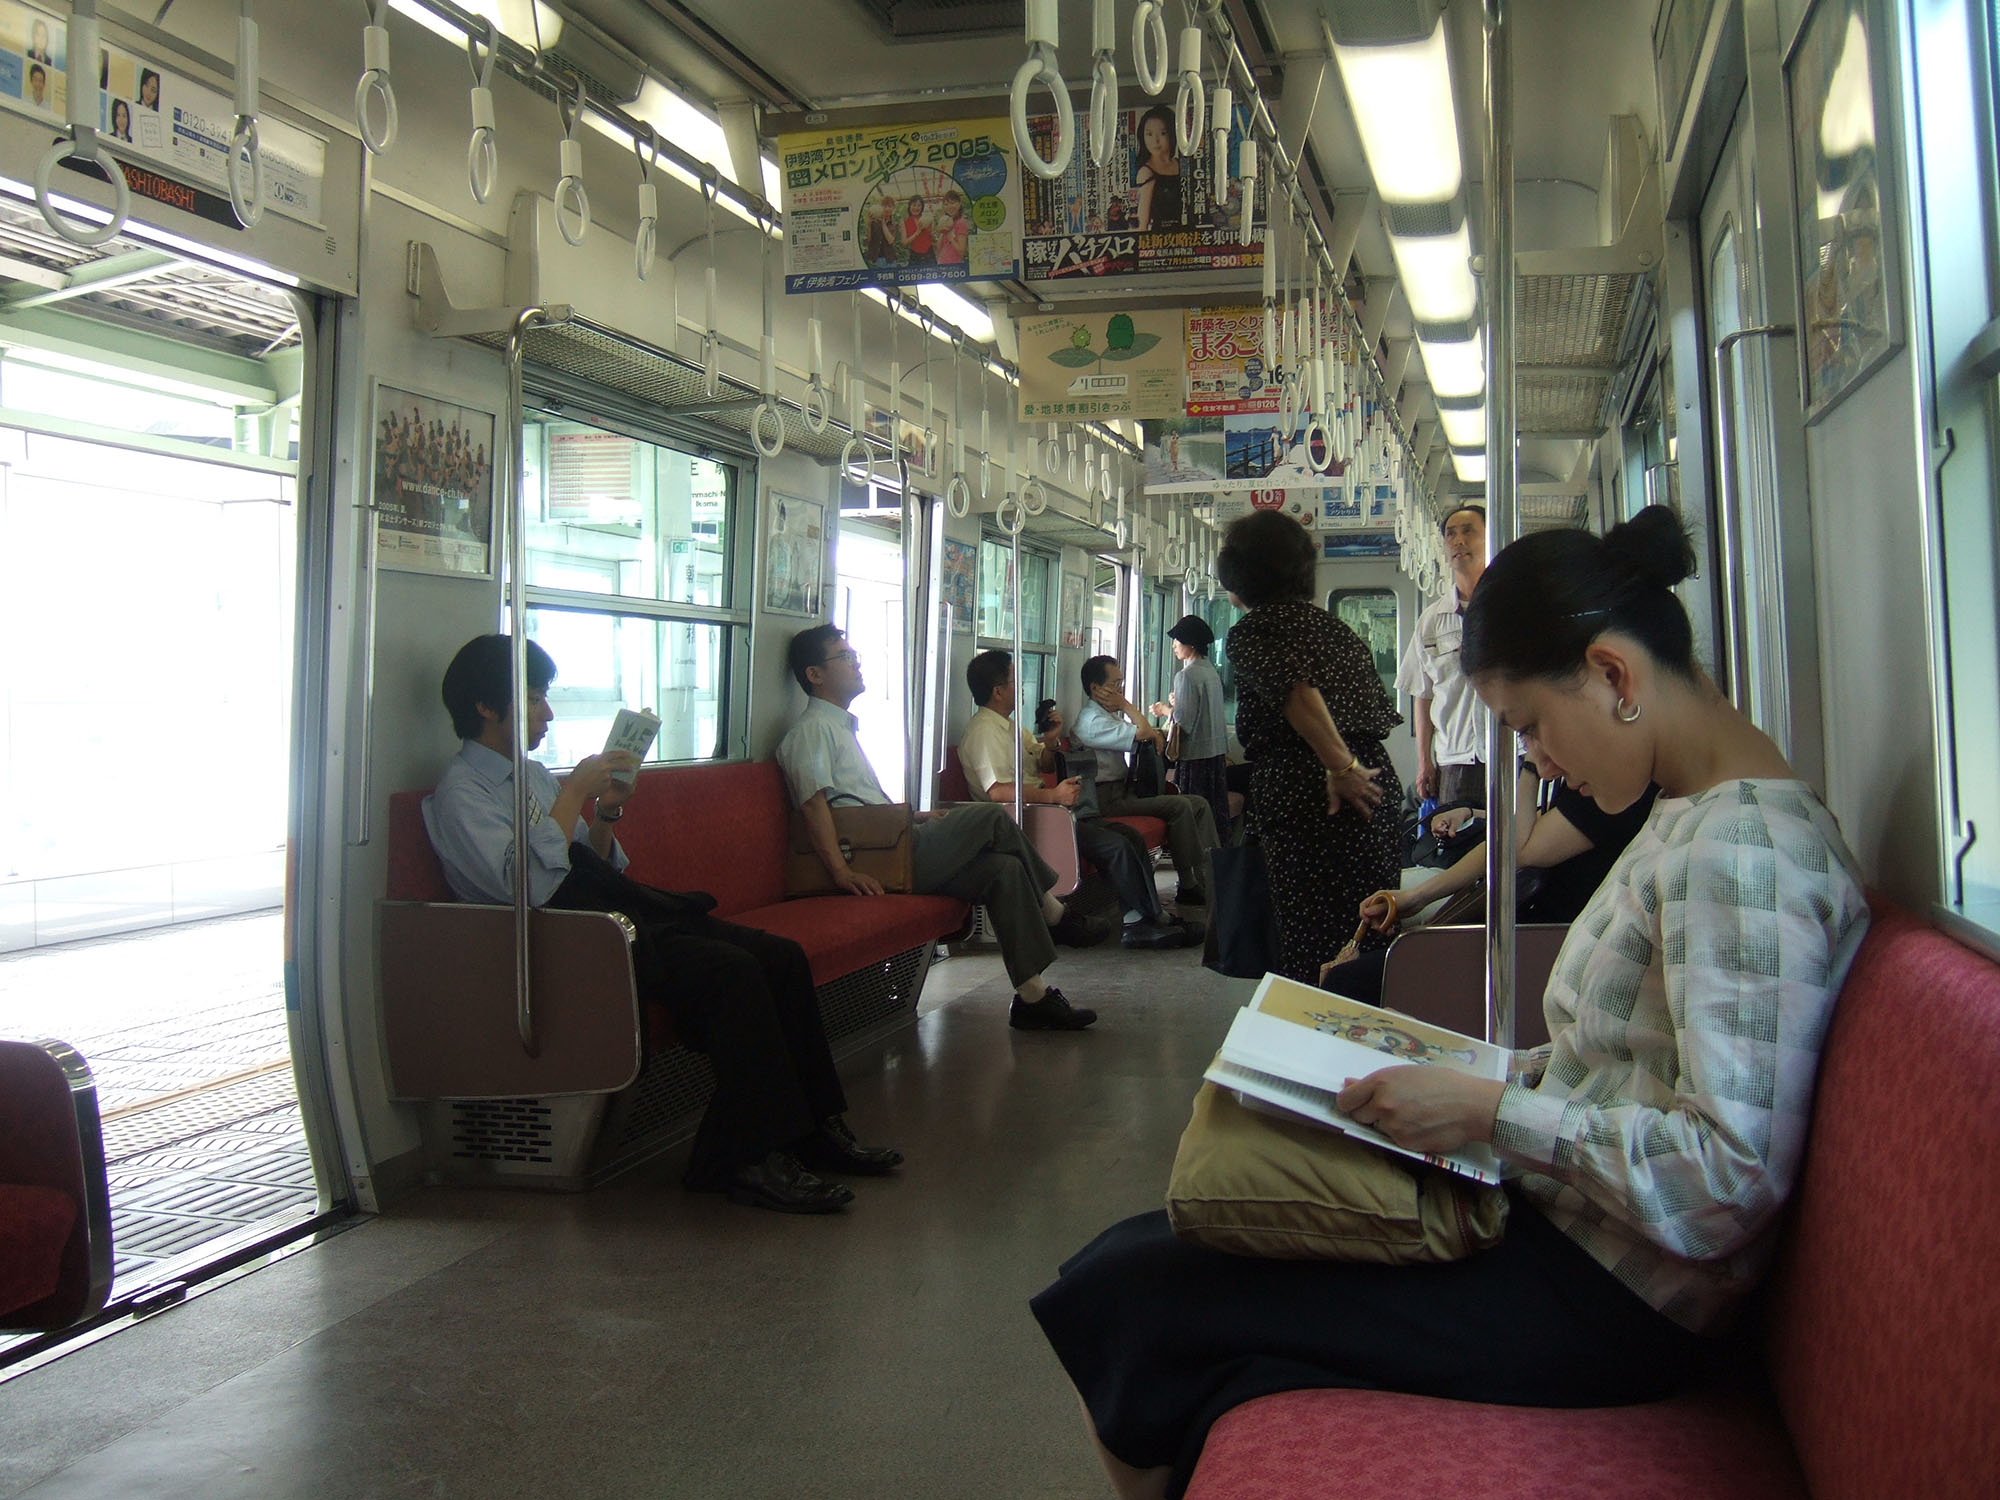
Ride comfort is one potential area of significant difference between BRT vehicles and rail vehicles. Rail is typically credited with a smoother ride performance both during starts and stops as well as during full operation. A smoother ride better permits value-added activities, such as reading (Figure 2.16). However, not all rail systems provide the same ride quality. The Kuala Lumpur monorail technology actually delivers a somewhat “bumpy” travel experience. Additionally, older tram systems may not provide an entirely smooth ride. Low-floor BRT vehicles can be susceptible to surface imperfections on the busway that will result in a “bumpier” ride. High-floor vehicles with ramped entry service can better mitigate this issue through dampening and improved suspension, at the expense of some vehicular capacity. However, in general, the ride smoothness of rail vehicles is superior to that of BRT vehicles.
2.4.5Image and Status
The perceived image and status of the public transport system plays a role in attracting ridership, particularly from non-captive public transport users who have other alternatives. The best-designed public transport system in the world becomes meaningless if customers do not find the system sufficiently safe and attractive to use.
In most but not all cities, rail-based systems have maintained an edge with regard to creating a modern and sophisticated image, though usually at a significant cost. Such an advantage becomes particularly important when attempting to attract ridership from car users. At the same time, the traditional image of the bus is relatively poor. Attracting middle- and higher-income users to the bus can thus be difficult. Image issues, though, are not entirely restricted to bus technology. Older or poorly maintained rail-based systems may also evoke images that are not entirely favorable to attracting customers (Figures 2.17 and 2.18). In Mexico City, for instance, the surface BRT system is preferred by upper- and middle-income residents to the underground subway system.
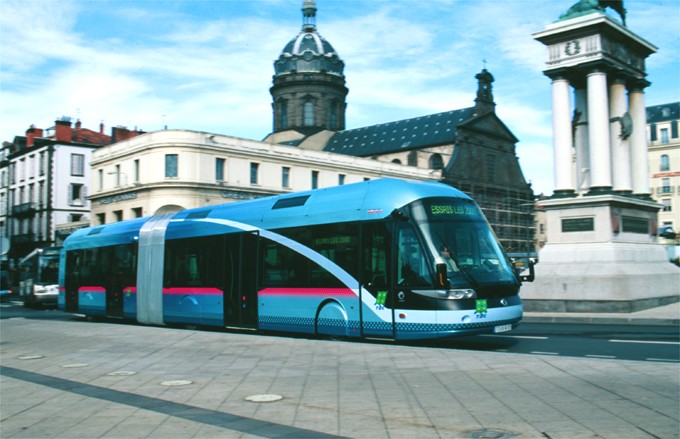
Image is mostly determined by the quality of the stations, and secondarily by the quality and the look and the feel of the vehicles. BRT systems have done much to create a modern and unique identity, mainly by developing stations with architectural merit and by using special buses. The modern tube boarding stations in Curitiba helped make a dramatic new impression for the service. Modern vehicles that cover their wheels and emulate the rounded shape of LRT vehicles also help create a new image (Figure 2.19).
In all countries where BRT has become most accepted to the general public, (Colombia, Mexico), high-quality station design and buses played a key role in convincing the public that BRT was a premium service. Passengers in Bogotá say not that they are “going to use the bus,” but rather that they are “going to use TransMilenio.” The marketing of the system name and the quality of the service has been helpful in creating a metro-like image.